When graduation rates decline, the assumption is that the damage concentrates in under-resourced districts — cities with high poverty, thin tax bases, and the chronic challenges that come with both. New Hampshire's 2025 data breaks that assumption.
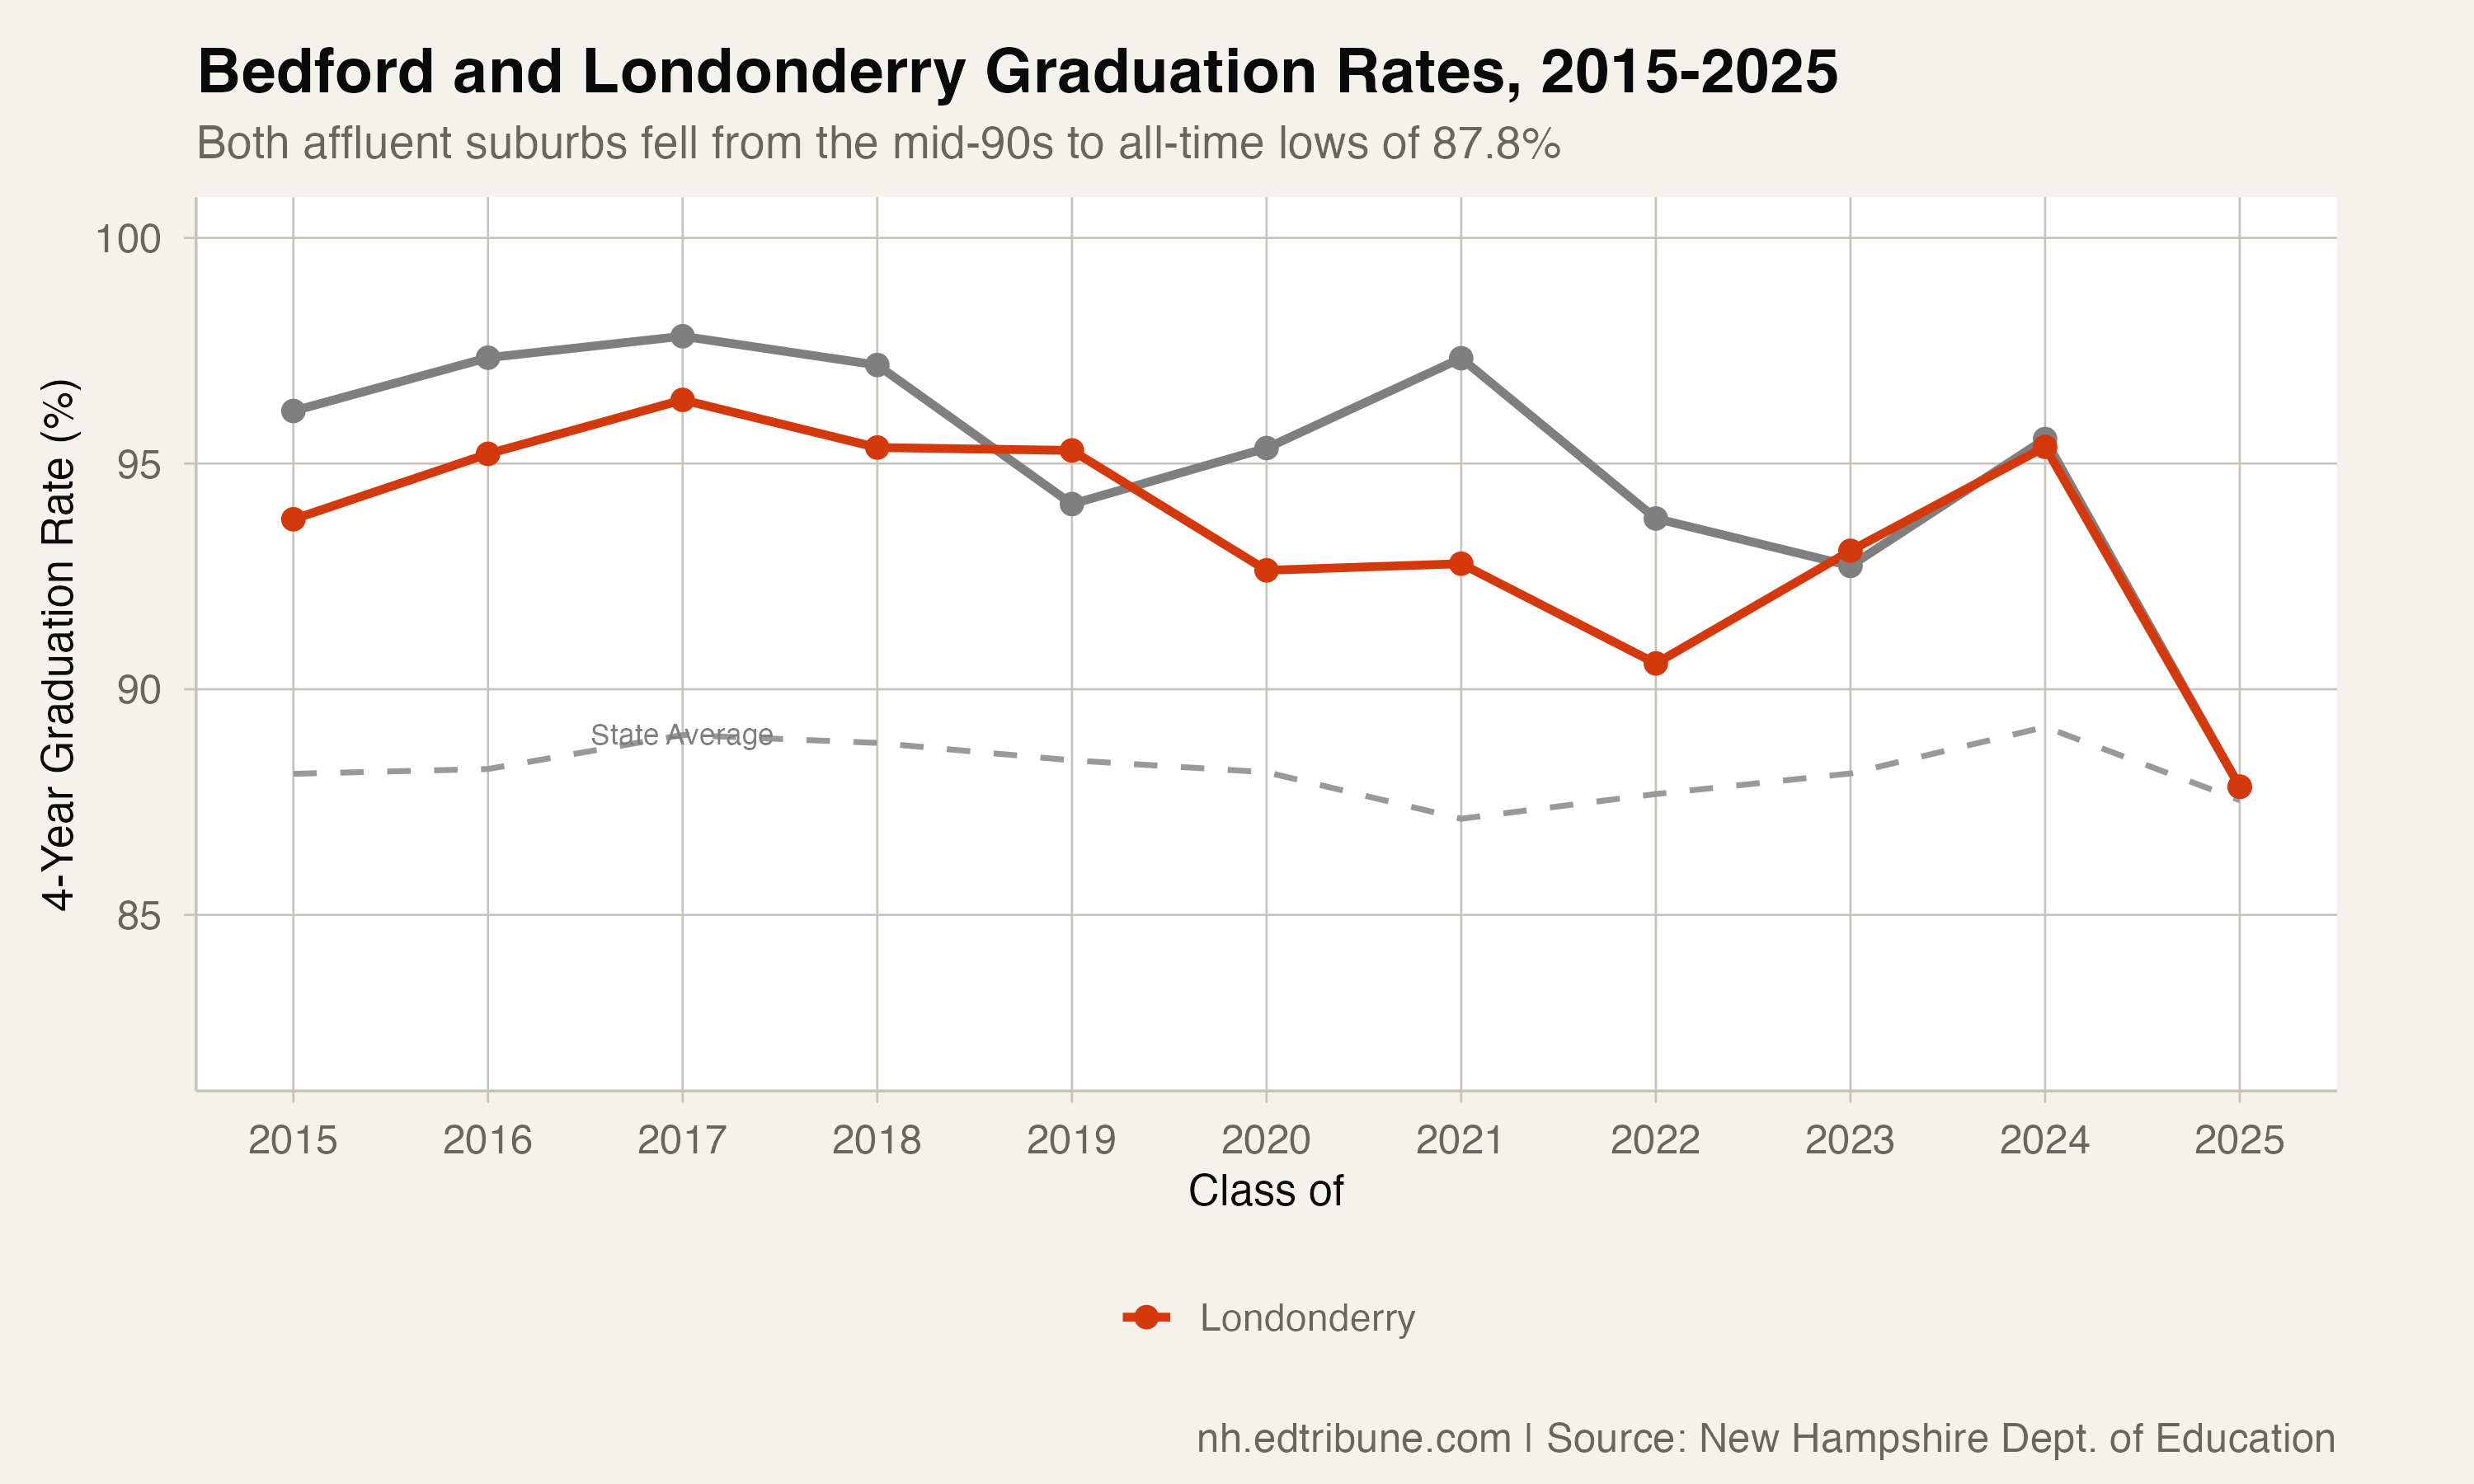
Bedford↗ET hit 87.8 percent, an all-time low. Londonderry↗ET hit 87.8 percent, also an all-time low. These are not struggling communities. They are among New Hampshire's wealthiest suburbs, places where median household incomes exceed $100,000, school funding is among the state's highest, and graduation had been virtually guaranteed for most of the past decade.
A 10-Point Decline
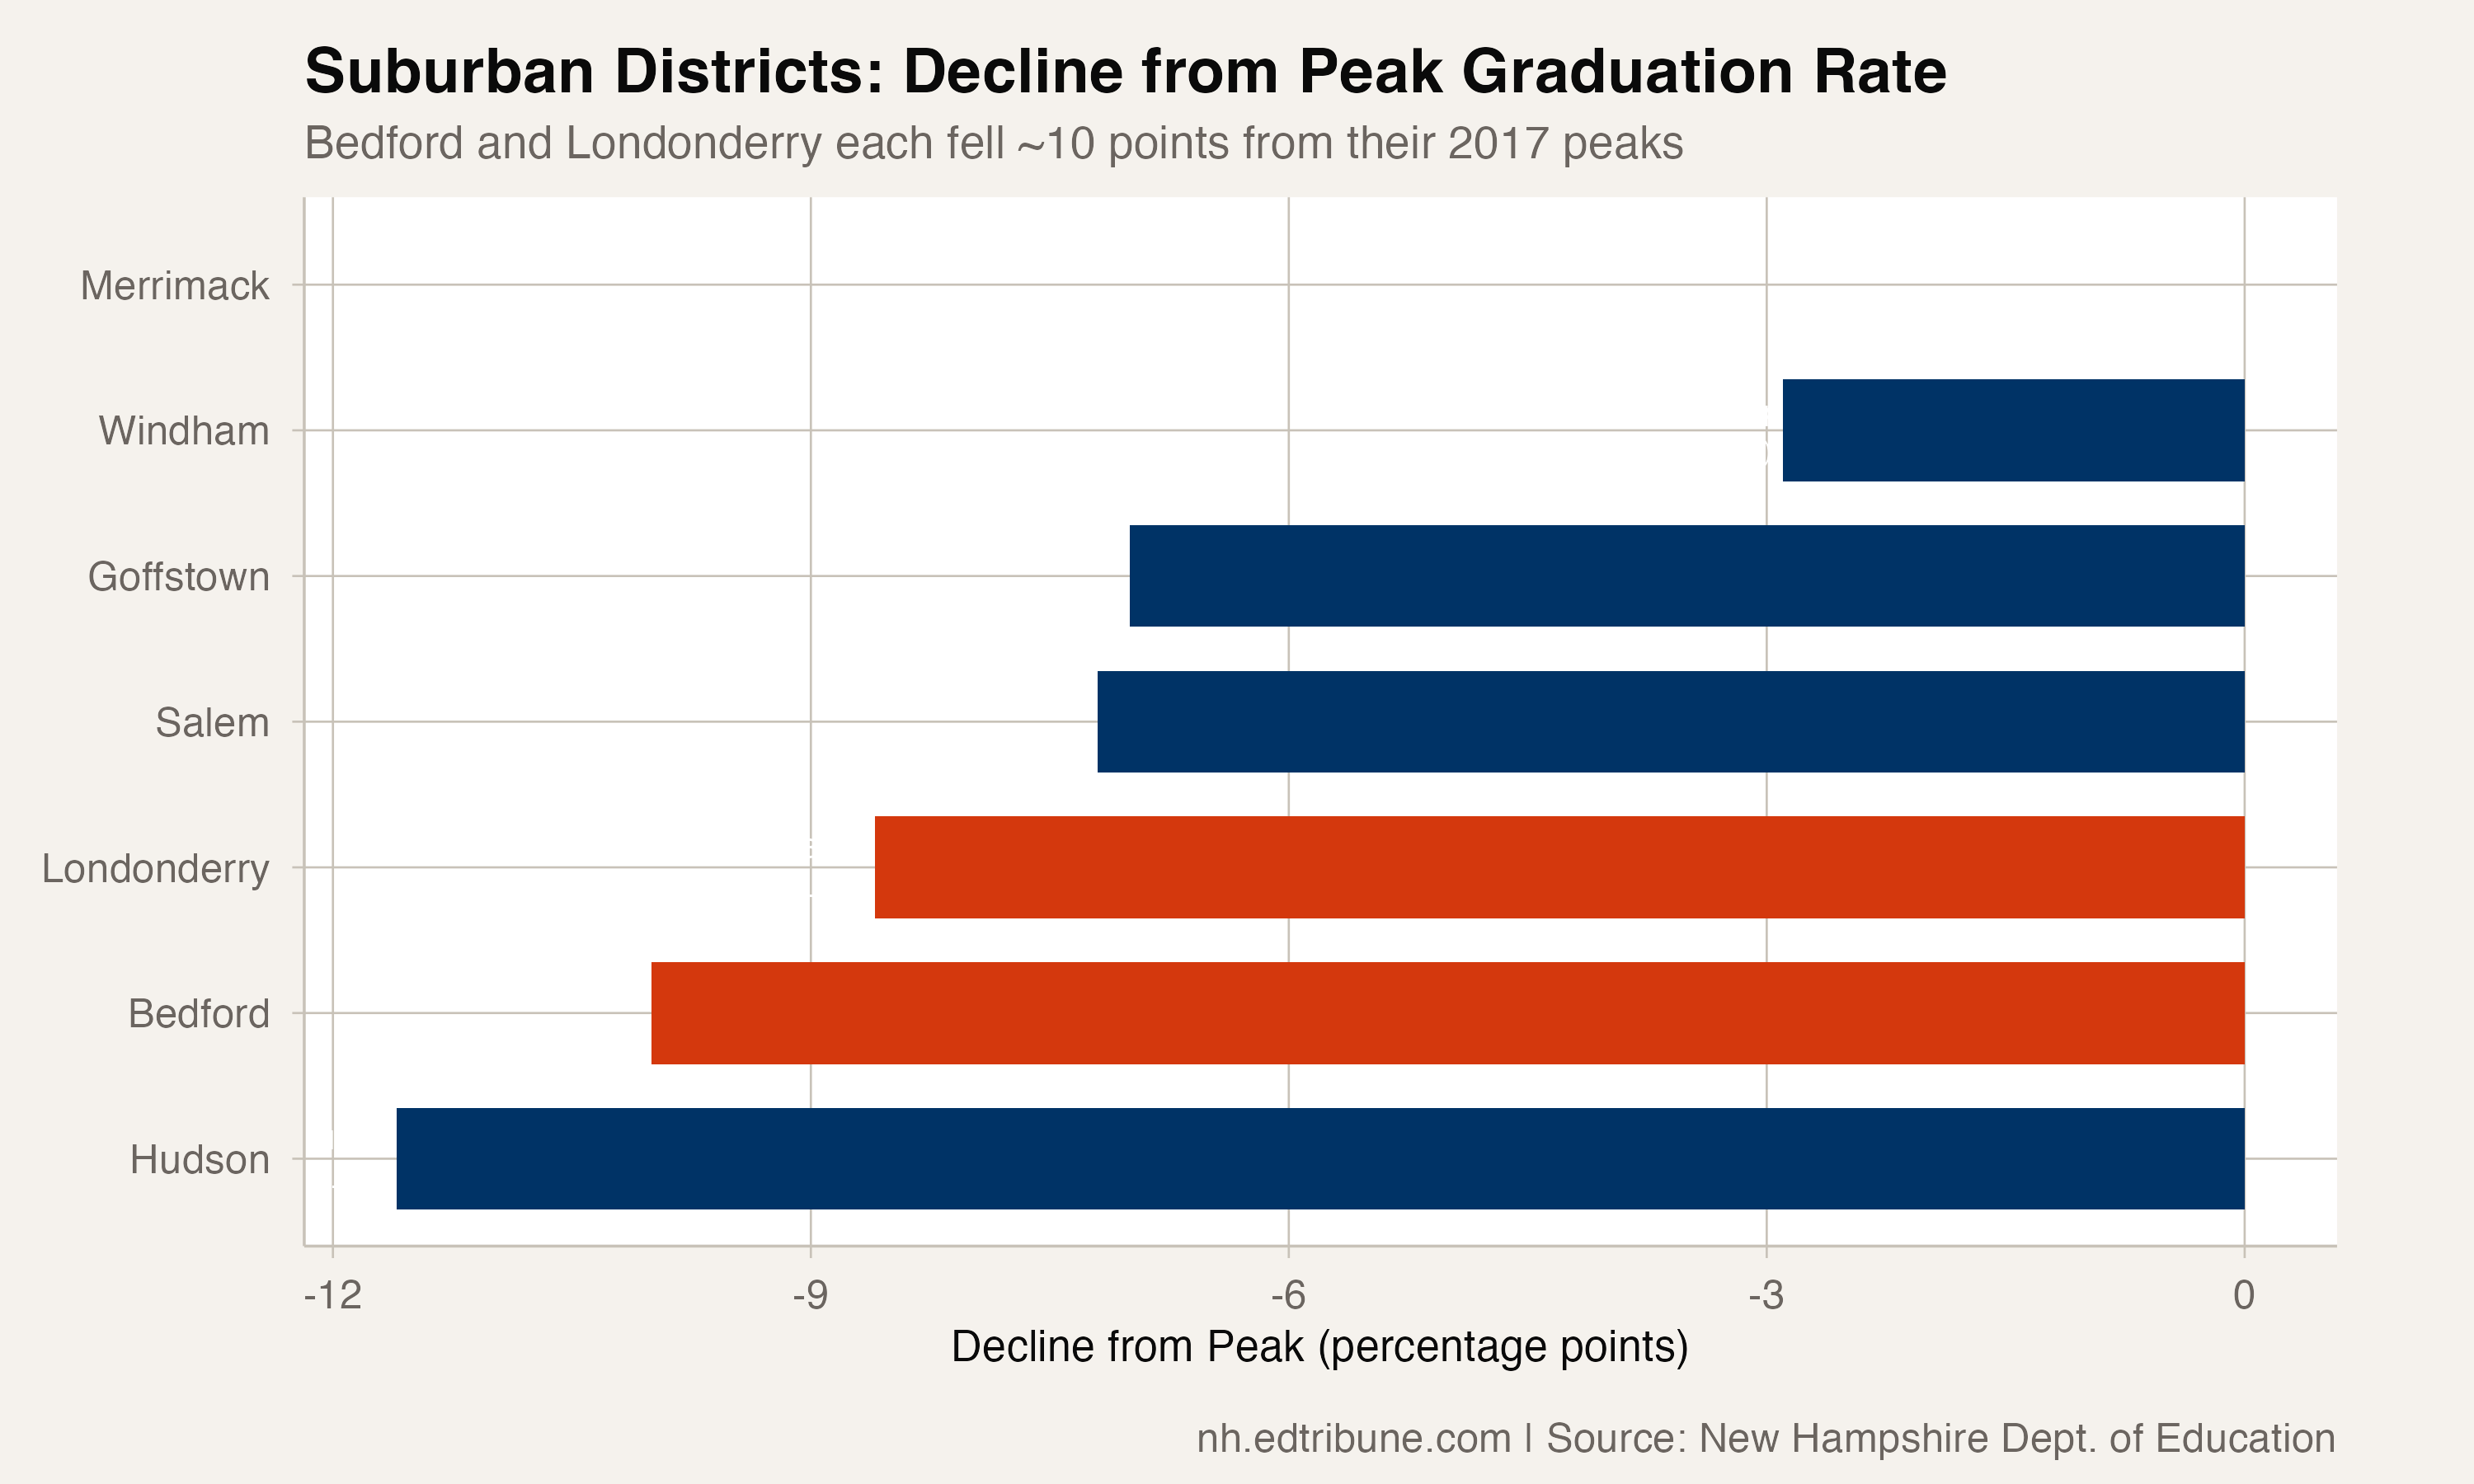
The scale of the decline is striking. Bedford peaked at 97.8 percent in 2017 — a rate that meant just 7 students in a cohort of 318 failed to graduate on time. By 2025, that rate had fallen to 87.8 percent with a 337-student cohort, meaning roughly 41 students did not finish. The decline from peak to current: 10.0 percentage points.
Londonderry's trajectory is nearly identical. The district peaked at 96.4 percent in 2017 and fell to 87.8 percent in 2025, a 8.6-point decline. Both districts dropped roughly 7.5 points from 2024 alone — the sharpest single-year decline either has ever recorded.
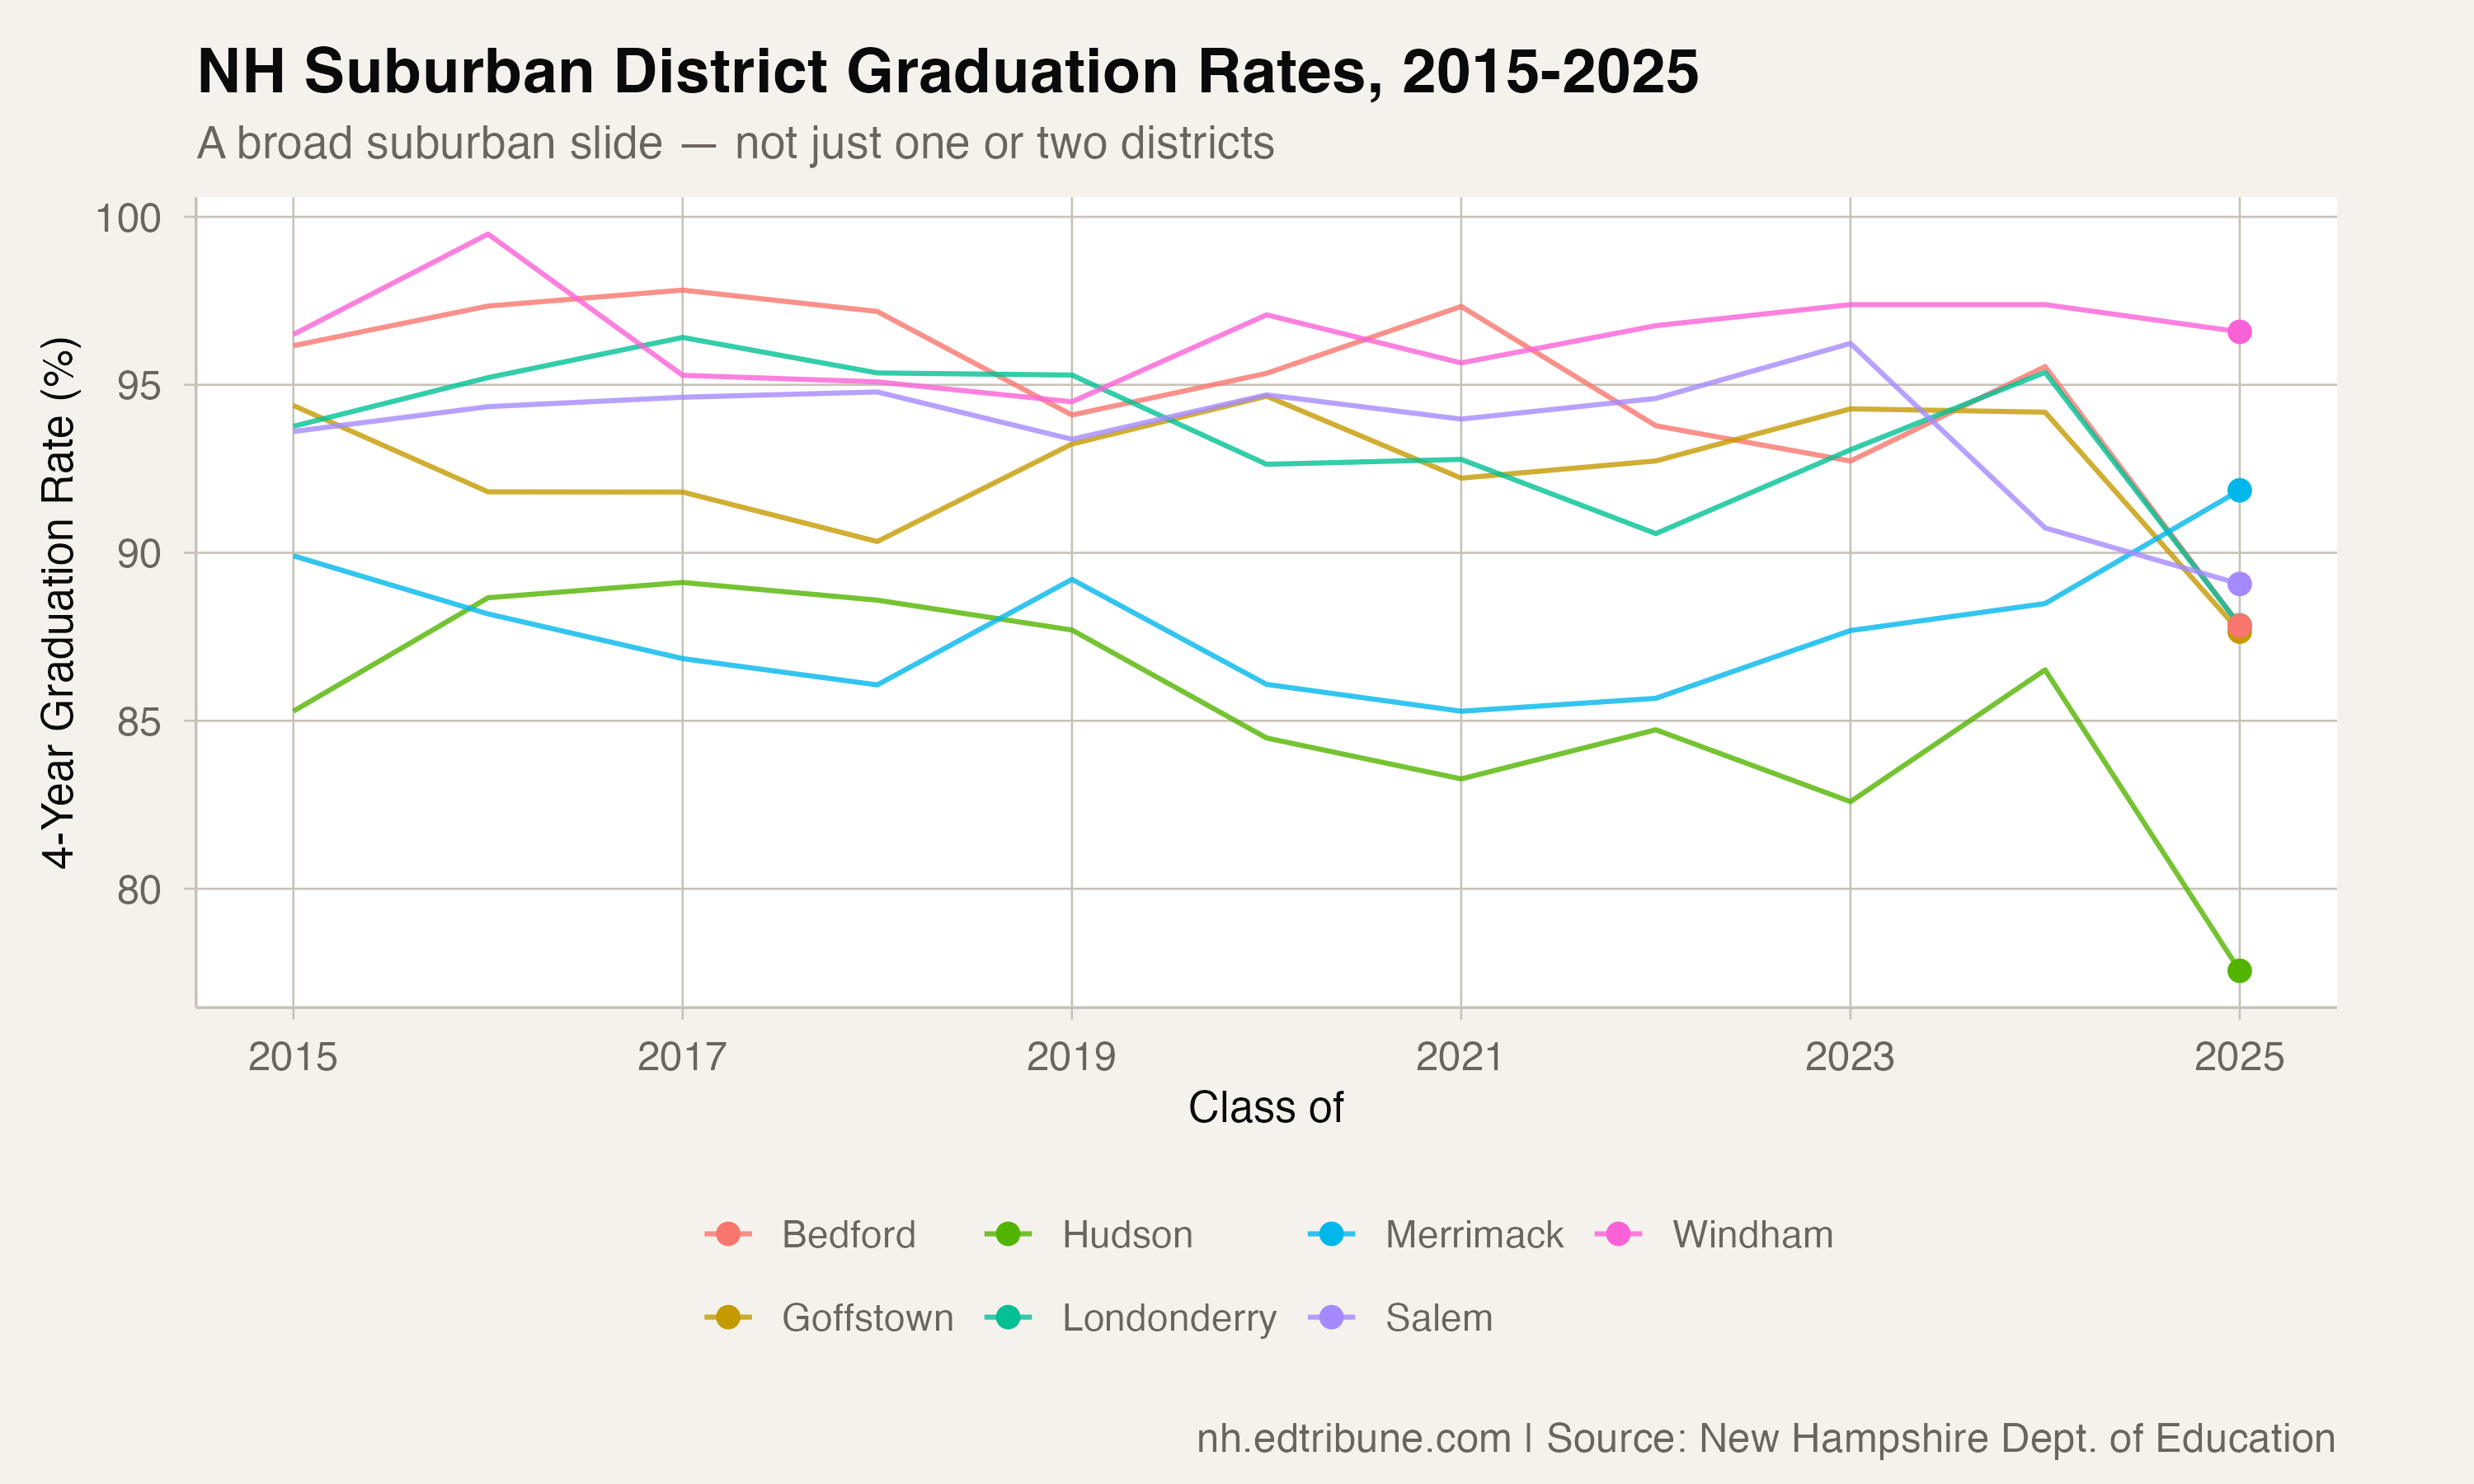
Not Just Two Districts
Bedford and Londonderry are the most prominent examples, but the suburban slide extends further. Among southern New Hampshire suburbs:
- Goffstown↗ET: peaked at 95.2 percent, now at 87.7 percent (all-time low)
- Hudson↗ET: peaked at 93.8 percent, now at 77.6 percent (all-time low)
- Salem↗ET: peaked at 95.7 percent, now at 89.1 percent
Not every suburb declined. Windham↗ET posted 96.6 percent in 2025, near its all-time high. Merrimack↗ET reached 91.9 percent, also a record. The pattern is not universal suburban failure — it is a significant subset of communities that were near the top now converging toward the state average.
What Affluence Does Not Protect Against
The suburban decline in 2025 is notable because it removes the most obvious explanations for low graduation rates. These districts do not lack funding. Their students are not, on average, facing the concentrated poverty that characterizes Manchester or Franklin. Their school facilities are well-maintained and their teacher retention is relatively high.
If funding, infrastructure, and community wealth were sufficient to maintain high graduation rates, Bedford and Londonderry would not be at all-time lows. Whatever drove the 2025 reversal — and without demographic breakdowns in the graduation data, the cause remains opaque — it reached into communities where the traditional risk factors for low graduation are largely absent.
One possible explanation is that chronic absenteeism, which doubled statewide from 13 to 24 percent between 2019 and 2023, may have penetrated suburban districts more deeply than earlier data suggested. Students who were chronically absent in 9th or 10th grade during the pandemic disruption years are now reaching their expected graduation date. If they accumulated credit deficits during those years, even affluent families and well-resourced schools may struggle to close the gap within four years.
Another possibility is cohort composition. In a district with 337 graduates, a single year with an unusually high share of students with disabilities, English learners, or other populations that historically graduate at lower rates could shift the overall number by several points. Without subgroup data, this explanation is speculative.
The Convergence Question
Bedford and Londonderry are now both at 87.8 percent — barely above the state average of 87.5. In 2017, both were roughly 8-9 points above the state. The gap between these affluent suburbs and the statewide rate has collapsed.
If the decline is temporary — a single bad year driven by an unusual cohort — the 2026 data will show a rebound. But if the decline reflects structural forces that have taken hold in suburban communities (chronic absenteeism, mental health challenges, post-pandemic disengagement), the convergence may persist. The question is whether 2025 was an outlier or a new baseline.
Bedford and Londonderry did not respond to requests for comment.
Data Source
This analysis uses four-year adjusted cohort graduation rate data from the New Hampshire Department of Education, covering the graduating classes of 2015 through 2025.
Detailed code that reproduces the analysis and figures in this article is available exclusively to EdTribune subscribers.
Discussion
Sign in to join the discussion.
Loading comments...