Something went wrong across New Hampshire in 2025 — not in one district, not in one region, but everywhere.
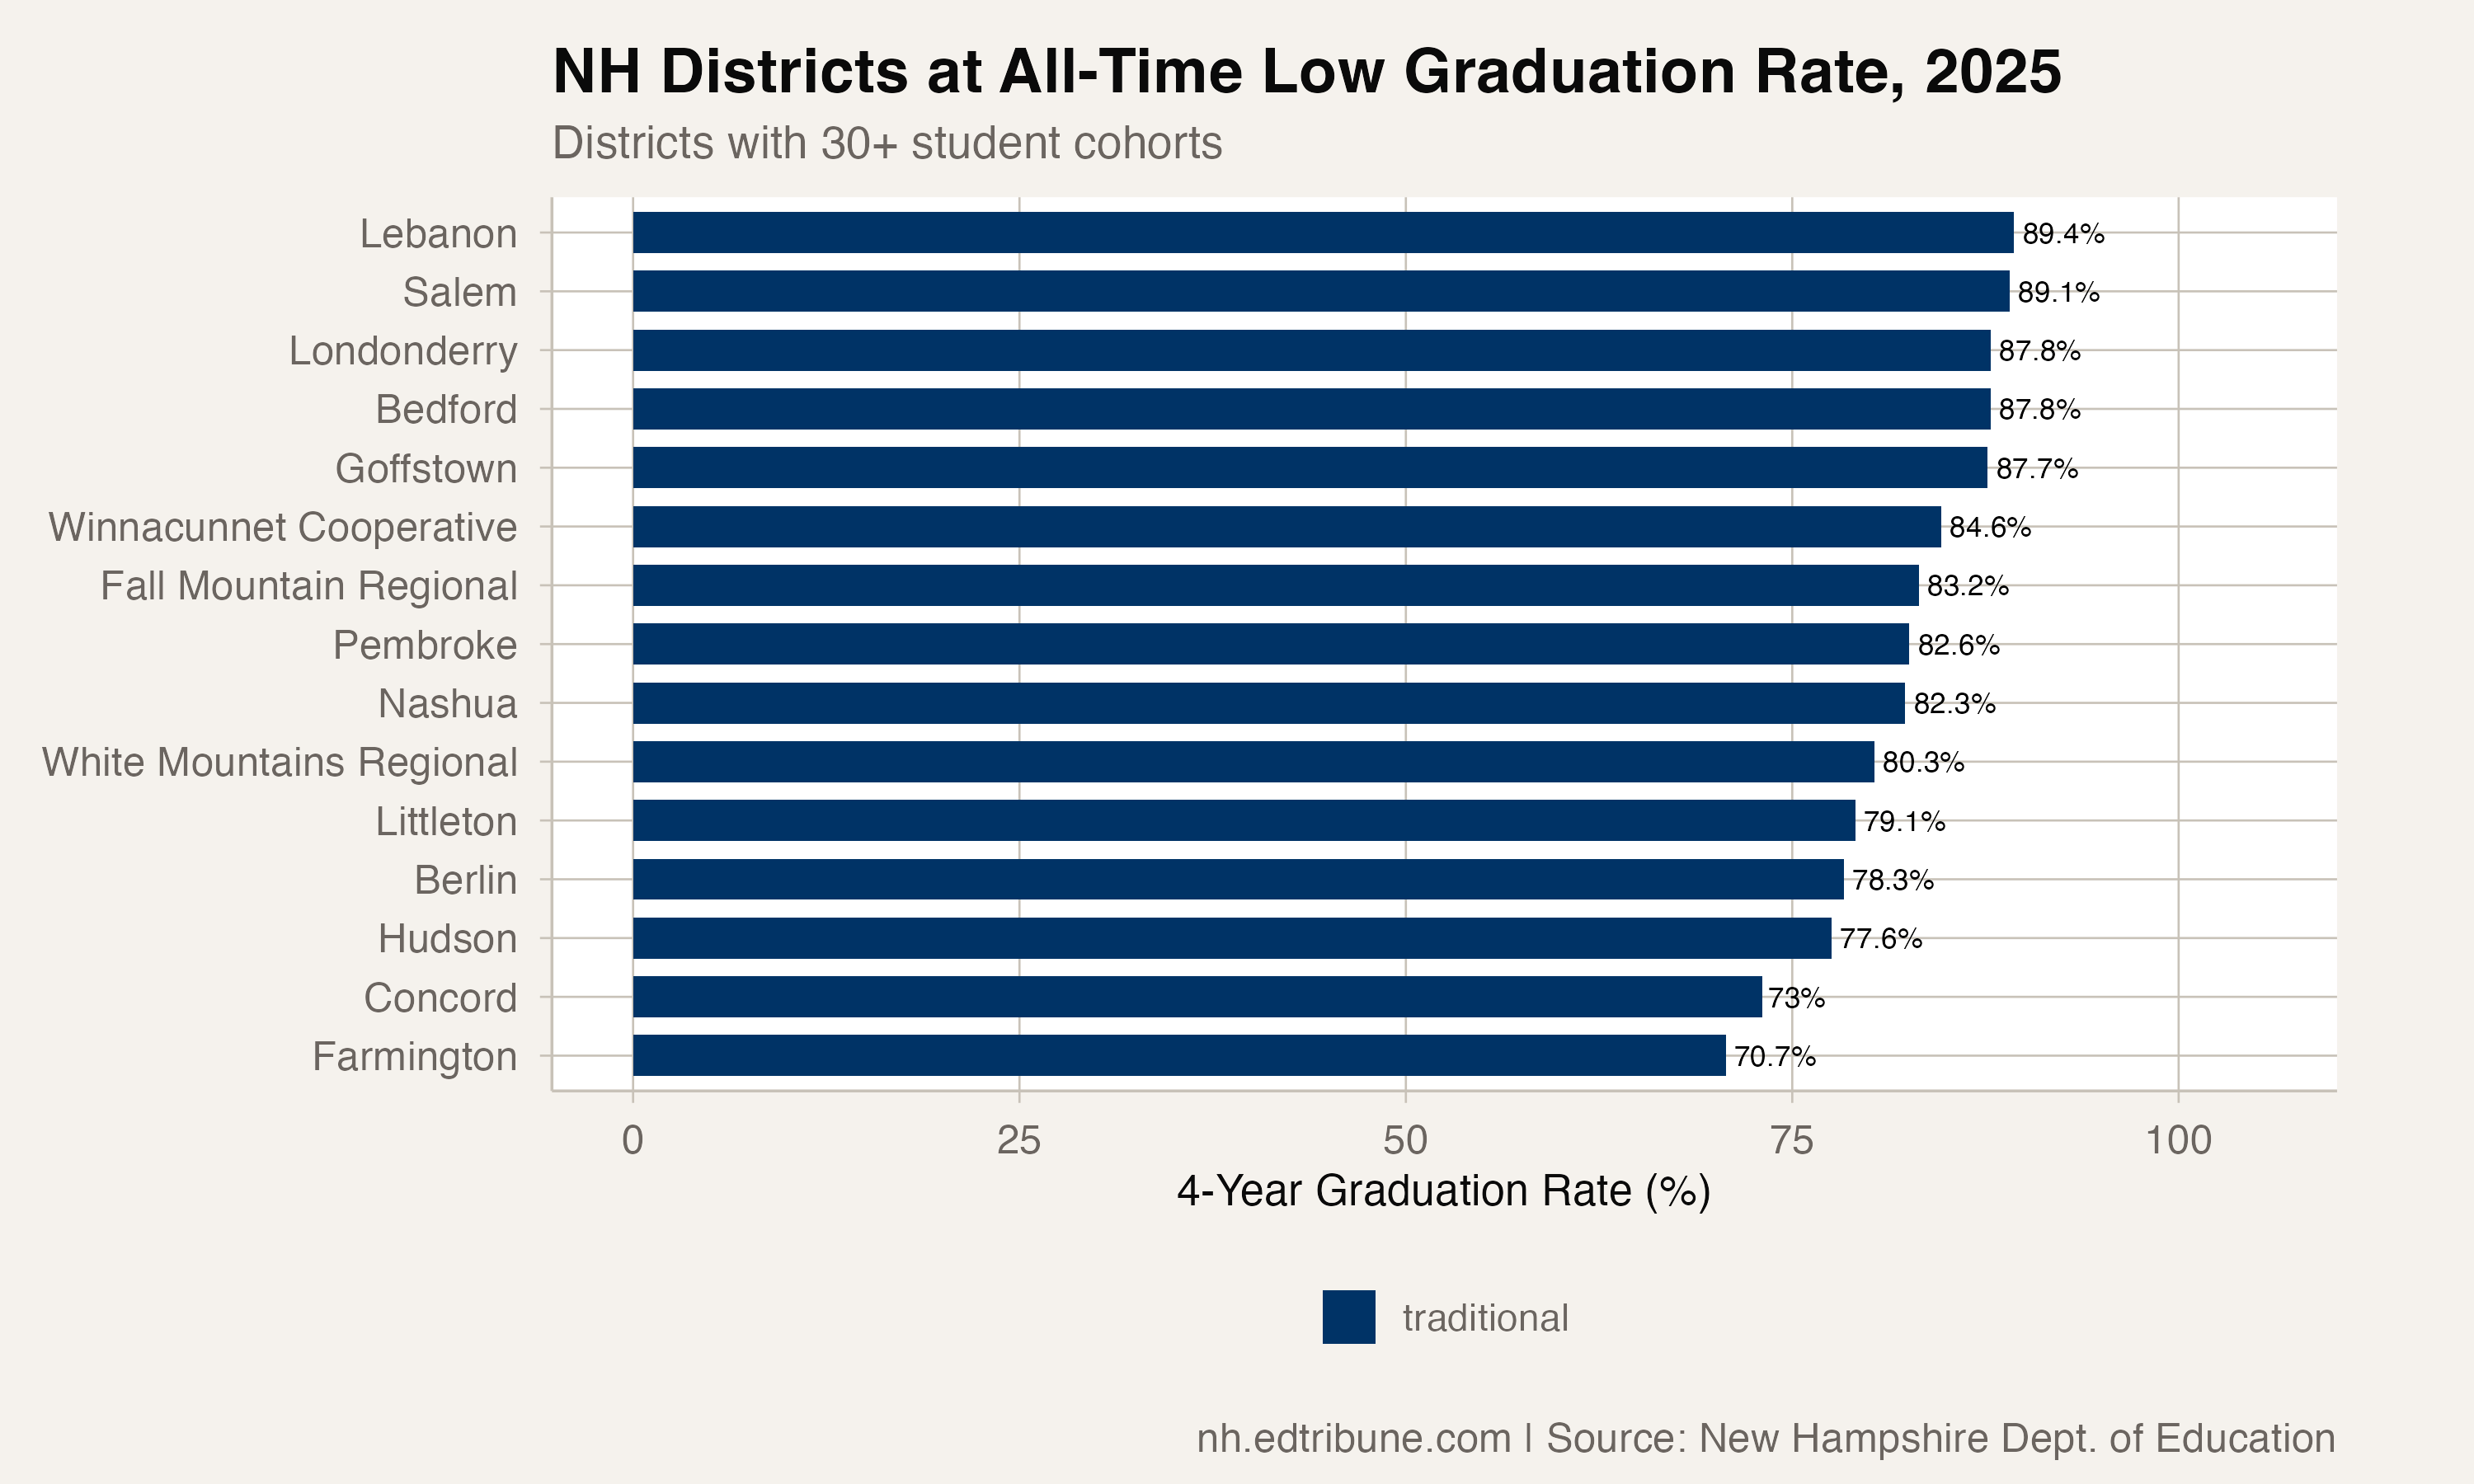
Twenty districts posted their lowest four-year graduation rate in at least 11 years of available data, a surge in all-time lows that cut across geography, wealth, and district size. The list includes the state capital (Concord↗ET, 73.0 percent), the second-largest city (Nashua↗ET, 82.3 percent), and a string of affluent suburbs — Bedford↗ET at 87.8 percent, Londonderry↗ET at 87.8 percent, Goffstown↗ET at 87.7 percent — that had never dipped this low.
This happened in a year when the state's dropout rate fell to its lowest level on record: 2.2 percent.
Where the Lows Hit
The 20 districts at all-time low are all traditional public school districts — not a single charter school appears on the list, though several charters carry far lower rates. What unifies the all-time-low districts is that 2025 represented a break from their own history, not that they are the state's worst performers in absolute terms.
Farmington↗ET, at 70.7 percent with a 58-student cohort, posted the lowest rate among traditional districts at all-time low. Hudson↗ET, a southern New Hampshire suburb of 254 graduates, fell to 77.6 percent. Berlin↗ET, the North Country's largest community, dropped to 78.3 percent.
But the most consequential records were set by larger districts. Concord's 73.0 percent — a 9.2-point drop from the prior year — left the capital with a lower graduation rate than Manchester↗ET, historically the state's weakest performer among large cities. Nashua's 82.3 percent extended a three-year decline streak that has erased a decade of progress.
The Contrast with All-Time Highs
Not every district fell. Eleven districts posted all-time highs in 2025, including Oyster River Coop↗ET at 99.1 percent, Epping↗ET at 100 percent, and Dover↗ET at 91.5 percent. Merrimack↗ET reached 91.9 percent and Windham↗ET hit 96.6 percent.
But the math is lopsided. For every district that reached a new peak in 2025, roughly two hit a new floor. In most prior years, the ratio was closer to even. The 2021 COVID year, when the state's overall rate dipped to 87.1 percent, produced fewer all-time lows than 2025.
Suburban Districts in Unfamiliar Territory
Perhaps the most striking feature of the 2025 data is where the new lows appeared. Bedford and Londonderry are communities where median household incomes exceed $100,000, school funding is abundant, and graduation has historically been all but guaranteed. Bedford peaked at 97.8 percent in 2017. Londonderry peaked at 96.4 percent the same year. Both have fallen roughly 10 points from those peaks — a decline that would be alarming in any district, but is shocking in communities with these resources.
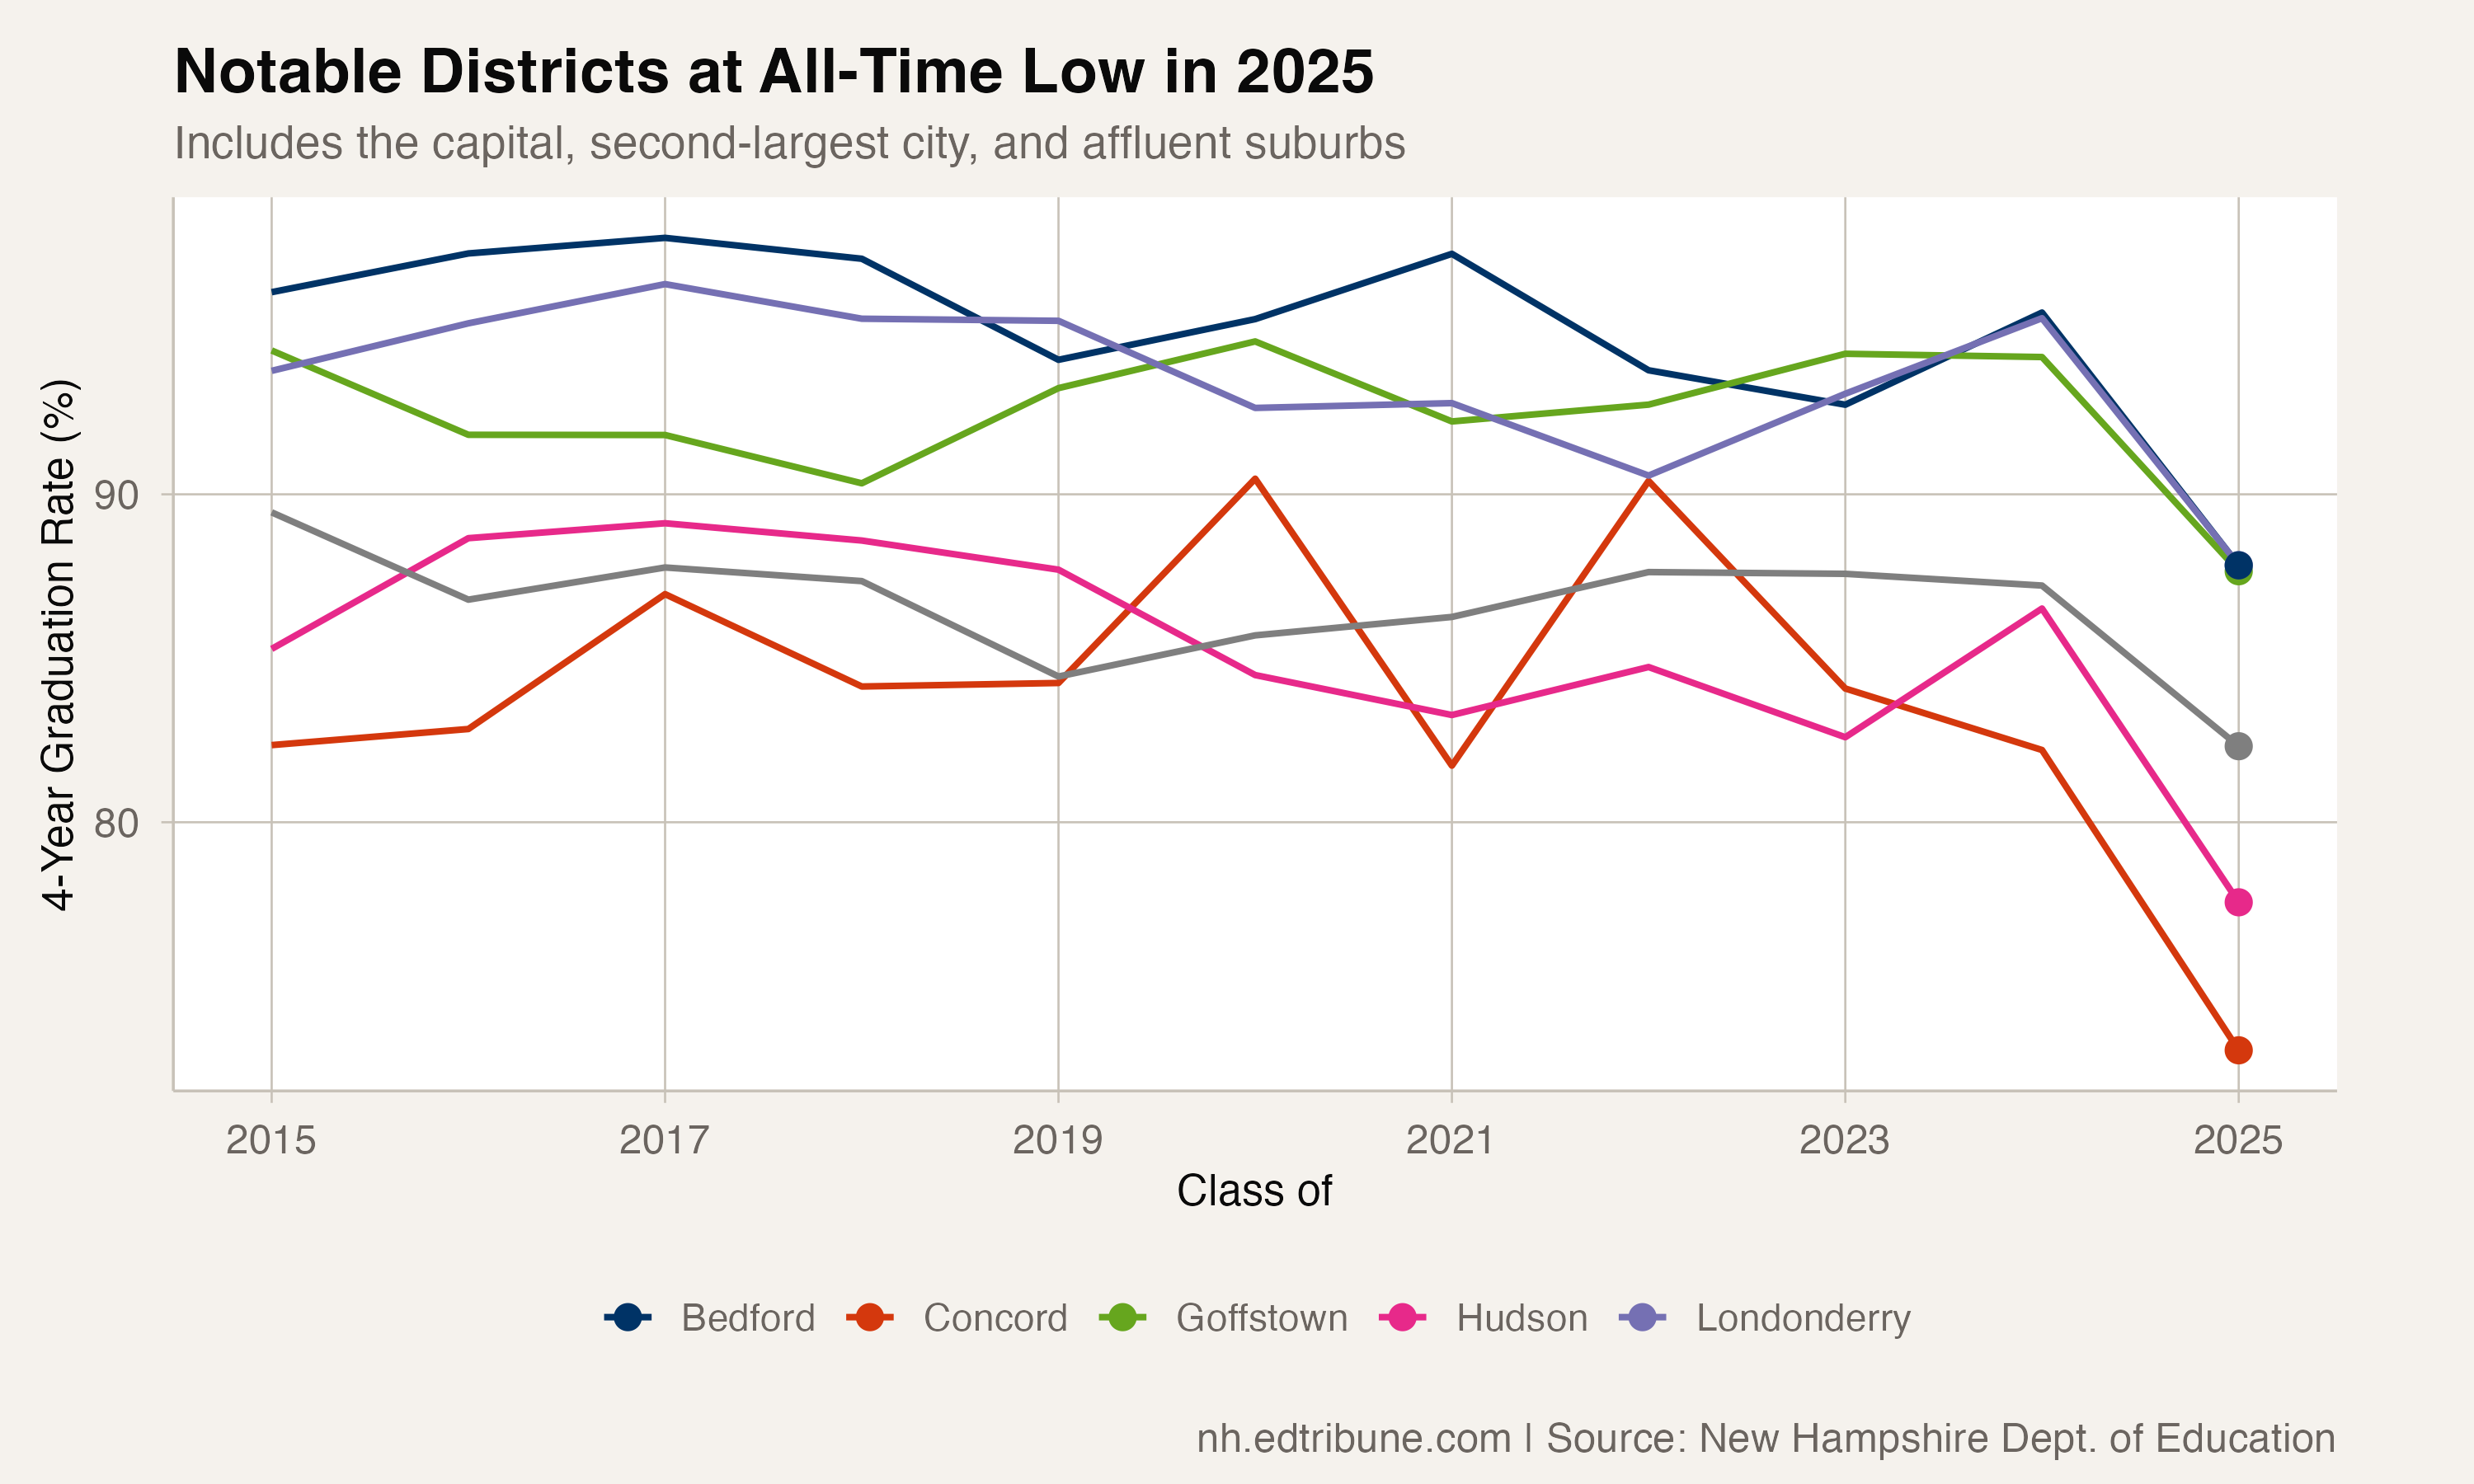
Goffstown, another southern New Hampshire suburb, dropped to 87.7 percent from a peak of 95.2 percent. Fall Mountain Regional fell to 83.2 percent. Pembroke hit 82.6 percent.
The pattern suggests that whatever drove the 2025 reversal — and the data cannot isolate a single cause — was not confined to under-resourced districts. It reached into communities where the educational infrastructure is, by any measure, strong.
The Missing Explanation
New Hampshire's graduation data lacks the demographic breakdowns that would help explain why 2025 was different. The state does not report graduation rates by race, income status, English proficiency, or disability designation at the district level. All we can say is that the dropout rate reached a historic low while the graduation rate also dropped, meaning the "unaccounted" population — students who were still enrolled, transferred, or earned a HiSET equivalency — grew to its largest share.
Whether the 20 all-time lows reflect a cohort-specific composition effect, the lagged impact of pandemic-era learning disruptions finally reaching the senior year, or something else entirely is a question the data raises but cannot answer.
The New Hampshire Department of Education did not respond to a request for comment.
Data Source
This analysis uses four-year adjusted cohort graduation rate data from the New Hampshire Department of Education, covering the graduating classes of 2015 through 2025. A district is classified as "at all-time low" if its 2025 rate equals its minimum rate across all available years, with at least three years of data required.
Detailed code that reproduces the analysis and figures in this article is available exclusively to EdTribune subscribers.
Discussion
Sign in to join the discussion.
Loading comments...