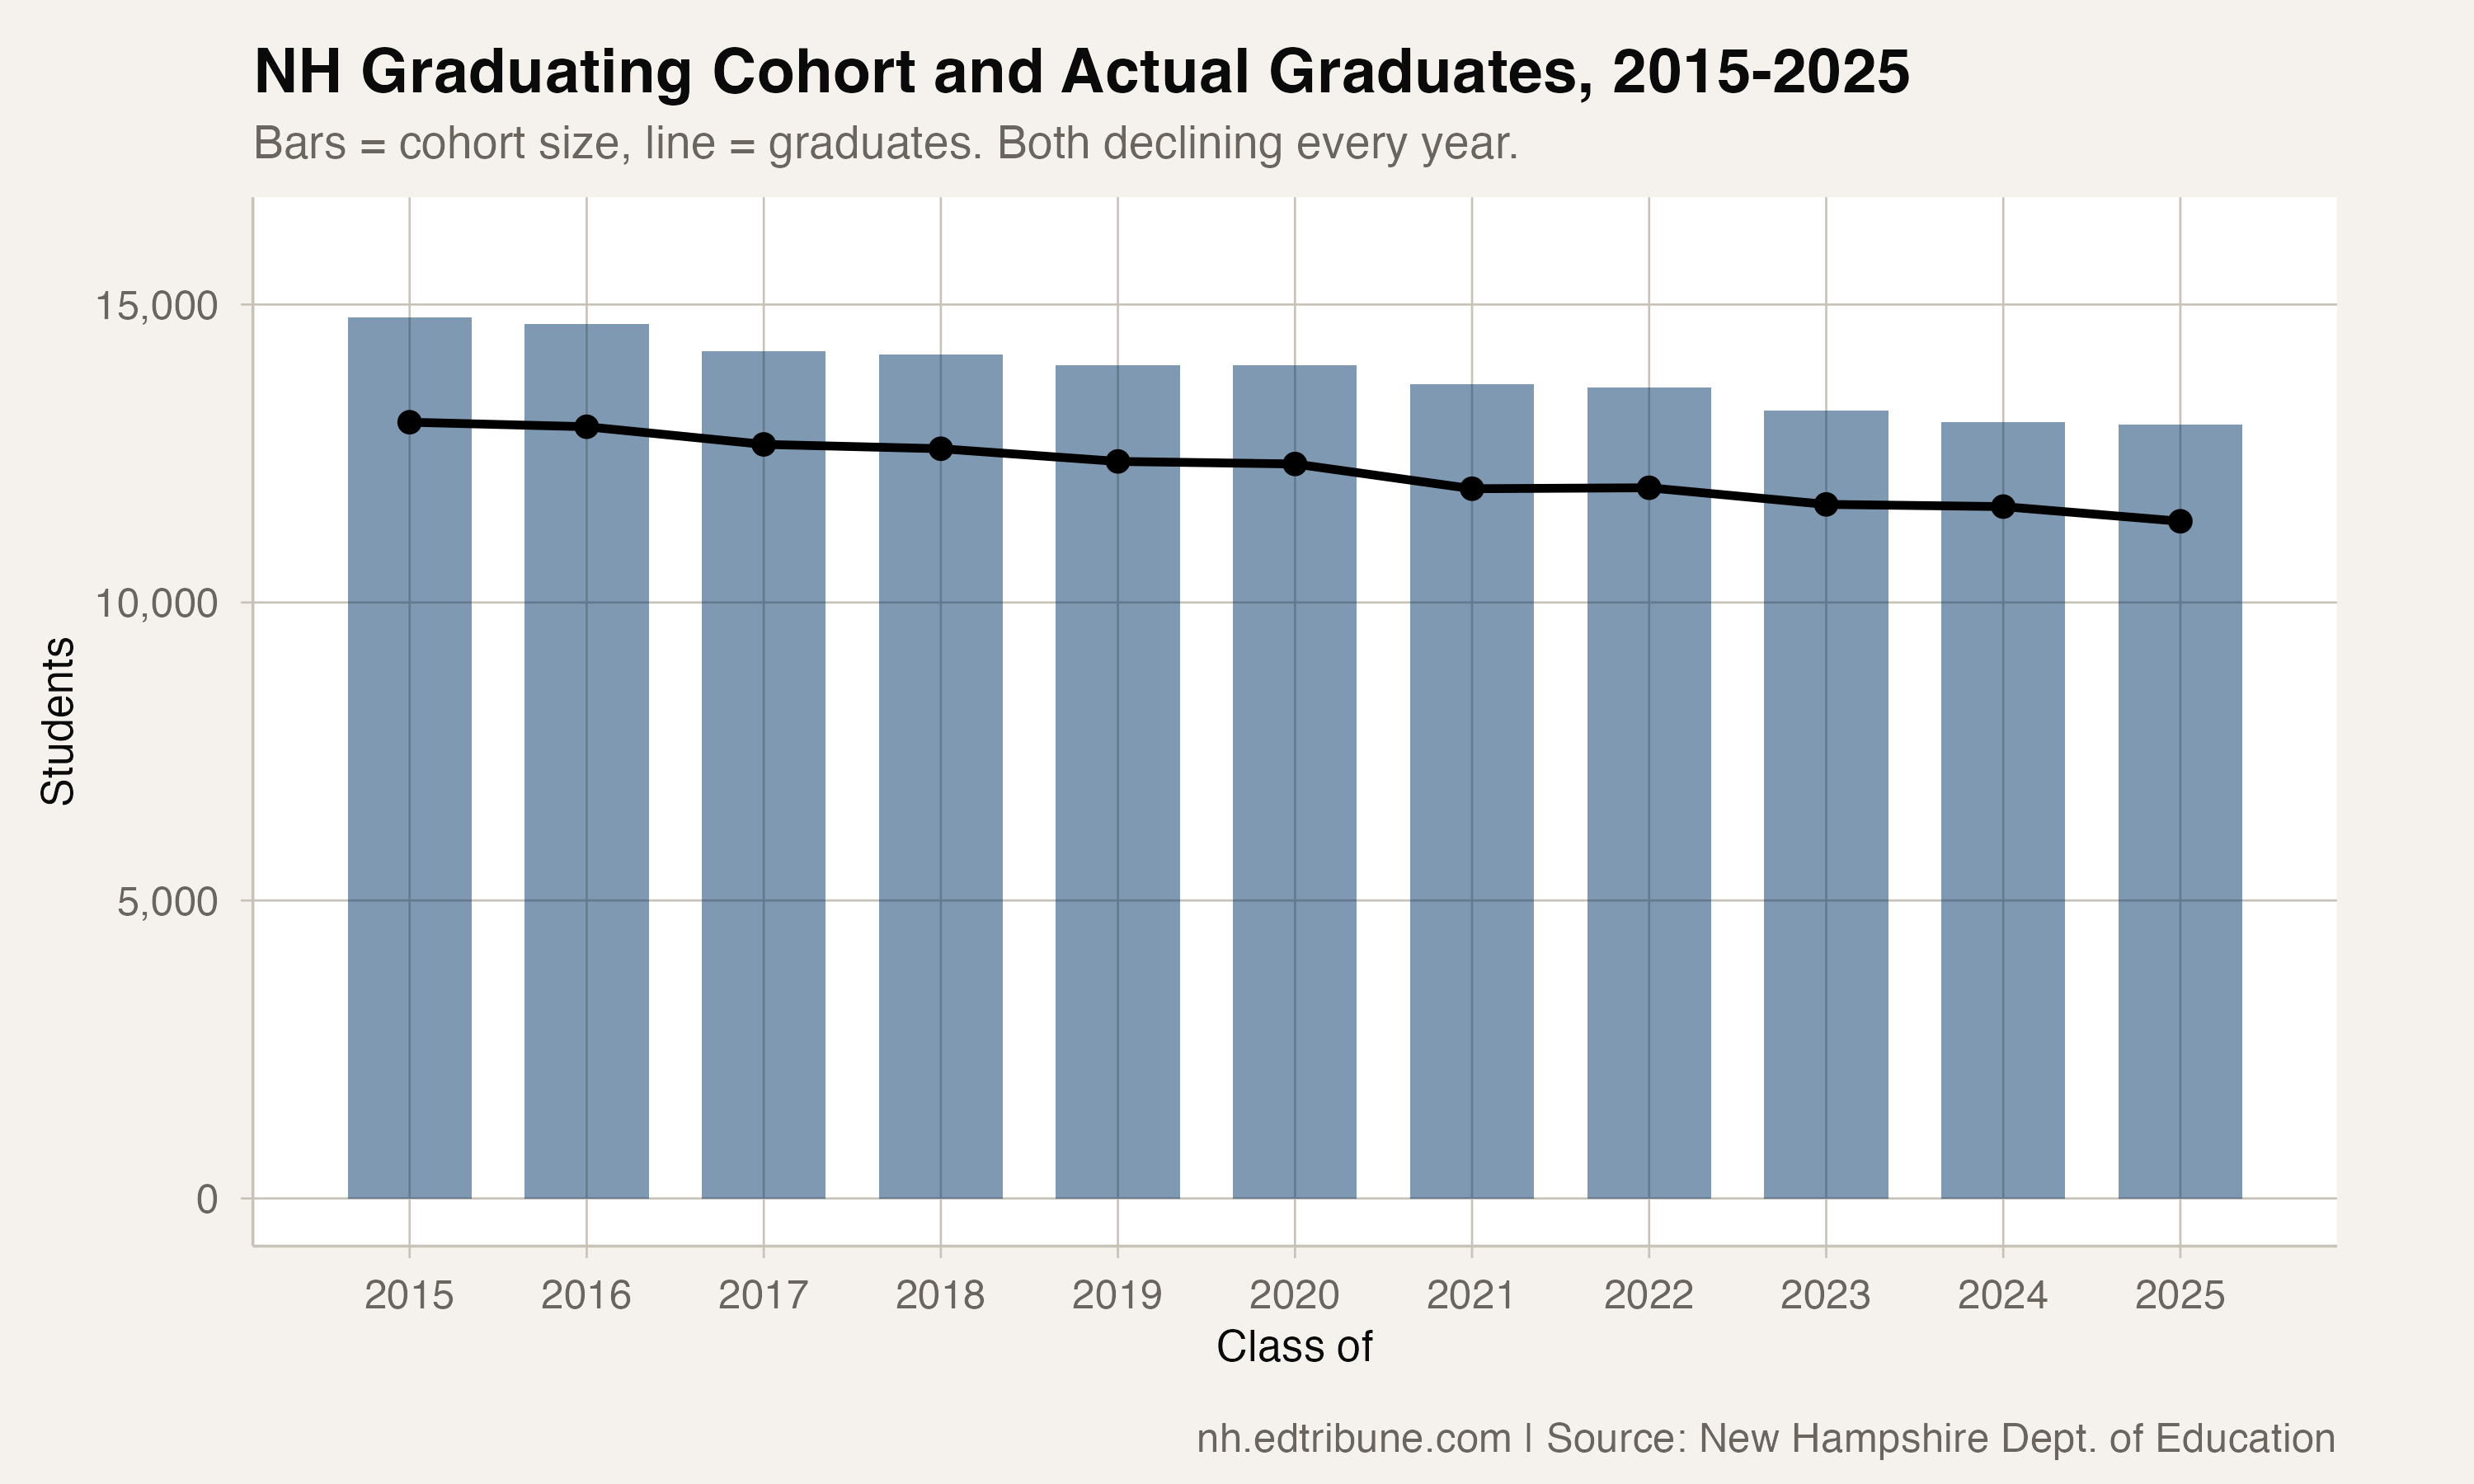
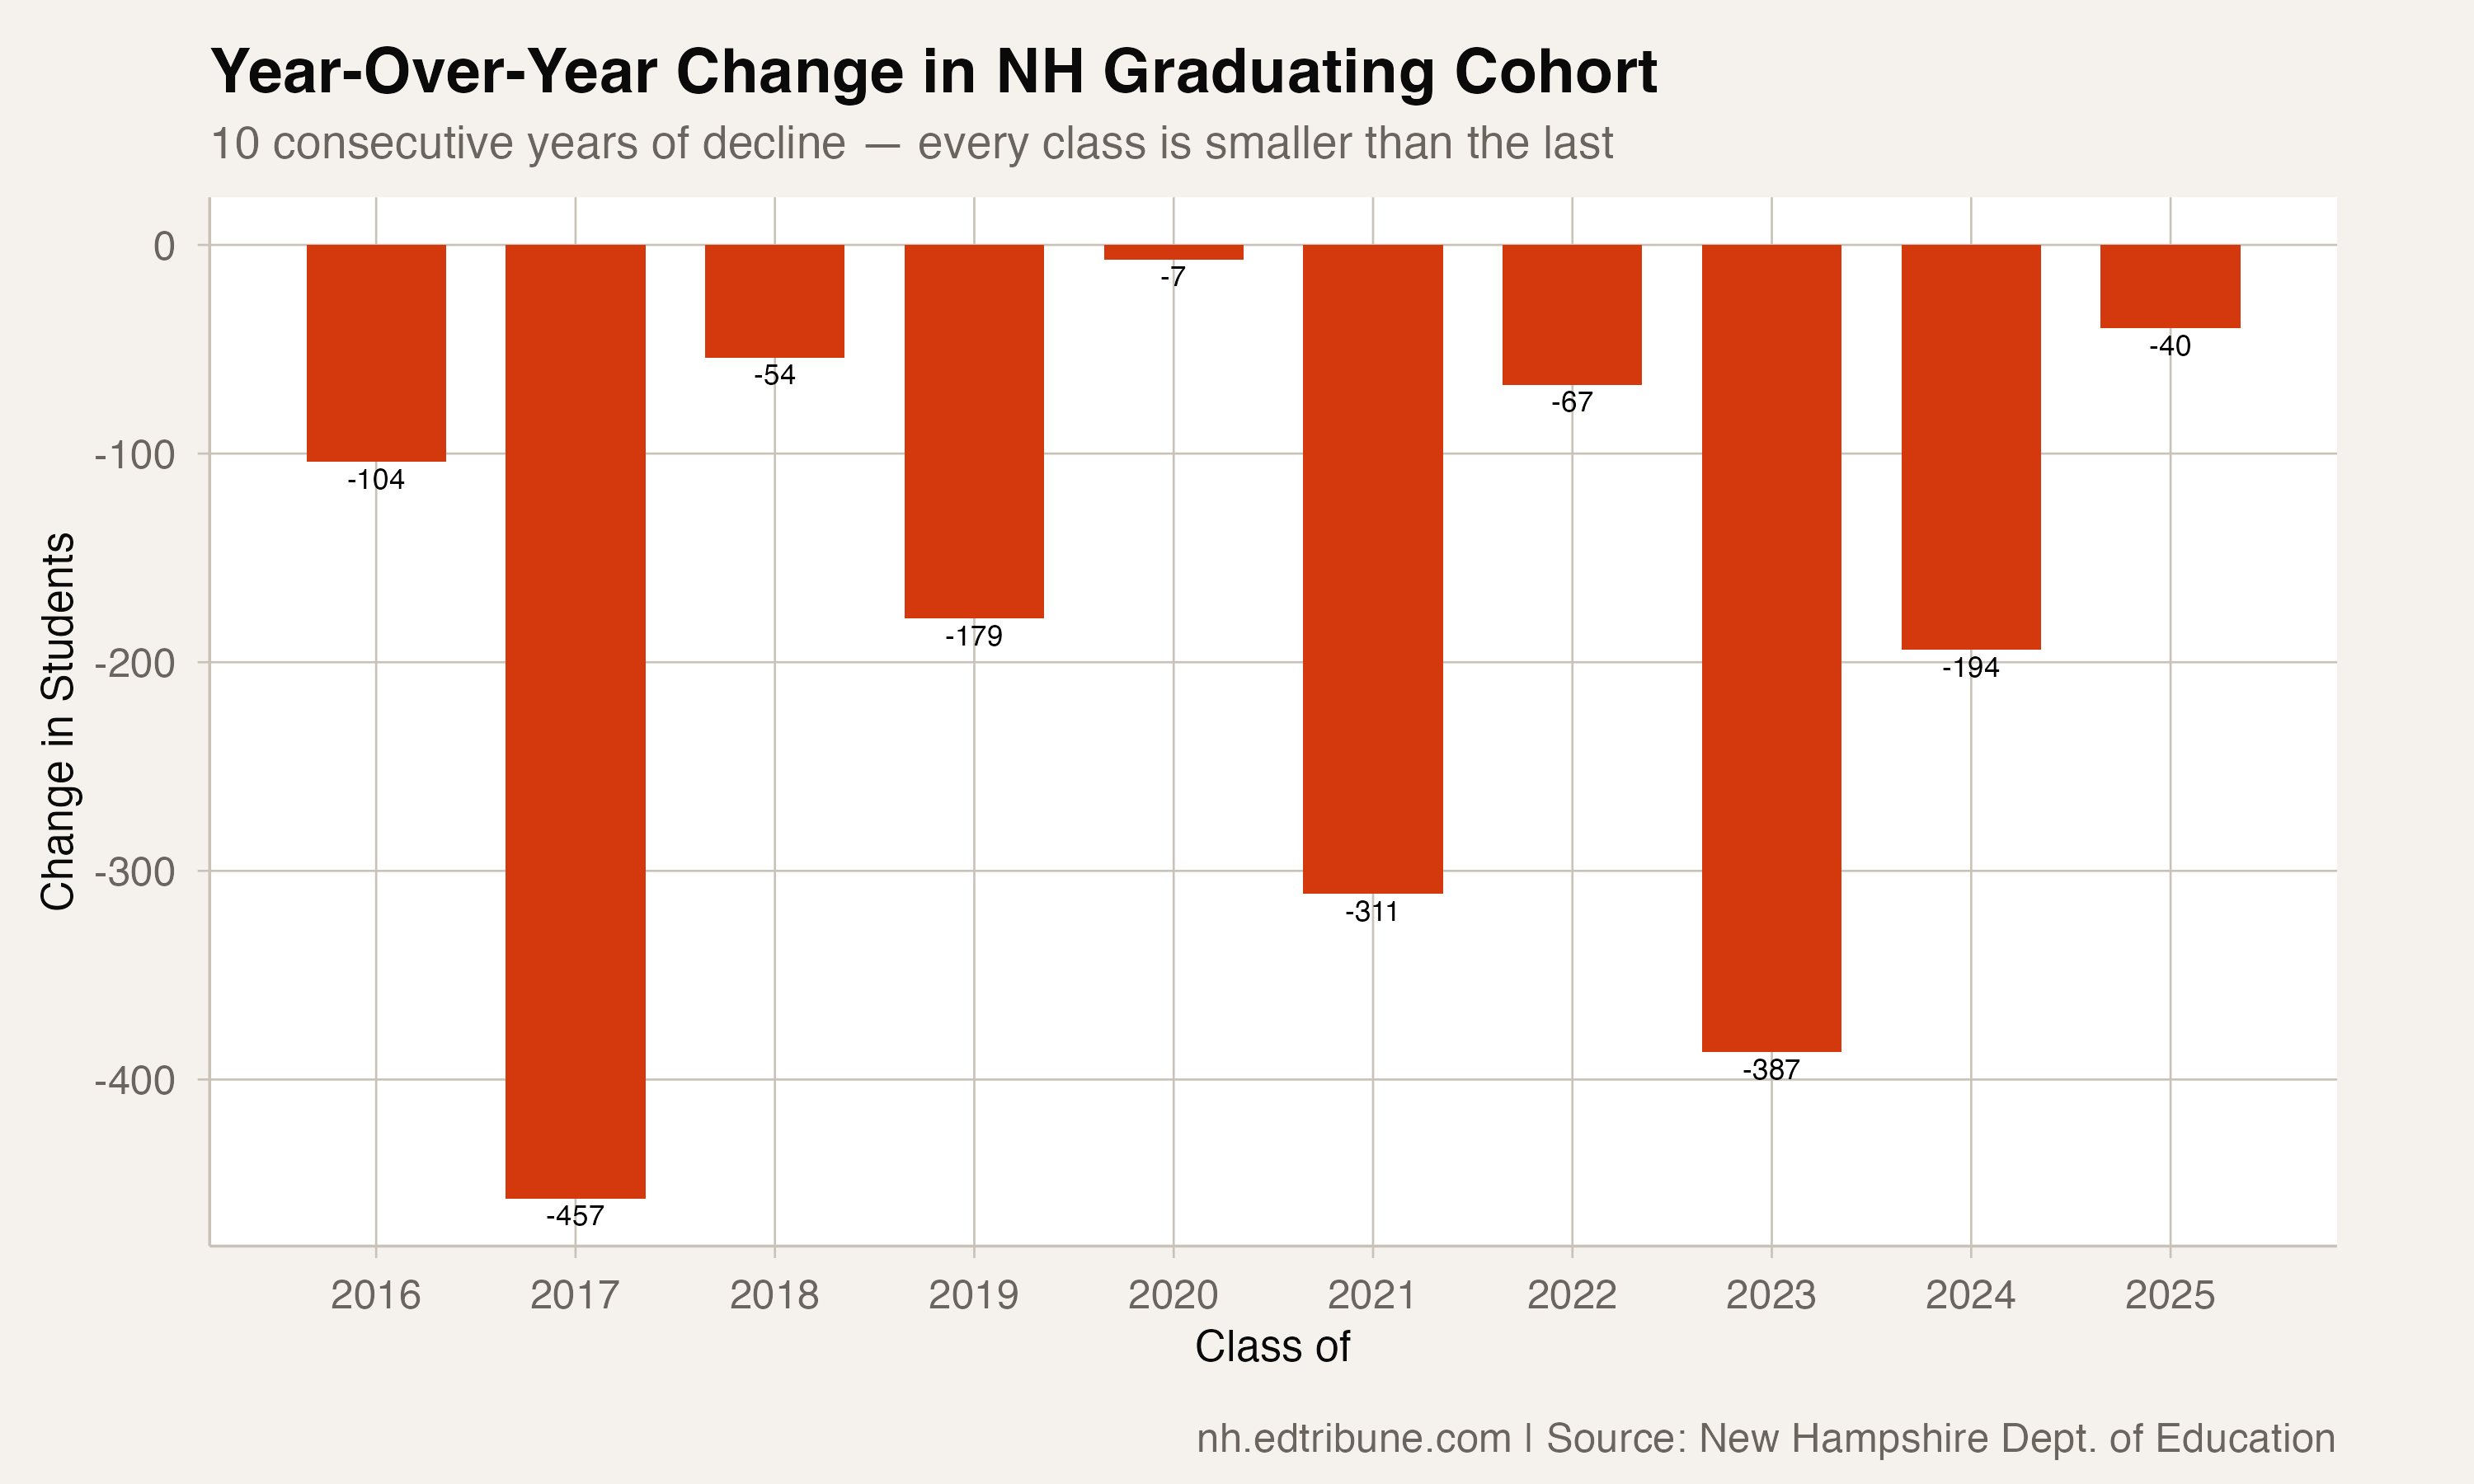
New Hampshire's Class of 2025 had 12,980 students. The Class of 2015 had 14,780. In every single year between, the cohort shrank — an unbroken ten-year streak of decline with no interruption, no pandemic bounce, no recovery year.
The 1,800-student drop amounts to a 12.2 percent decline in the graduating pipeline, and it is producing consequences that graduation rate statistics alone cannot capture. Even if New Hampshire graduated students at the same rate it did a decade ago, the state would be producing 1,662 fewer graduates per year — 11,363 in 2025 compared to 13,025 in 2015.
Driven by Demographics
The shrinking cohort is the downstream effect of the most dramatic demographic shift in any state's recent history. New Hampshire lost 18.4 percent of its K-12 enrollment over two decades — the largest decline in the nation. Birth rates fell from roughly 14,000 per year in the early 2000s to 11,000-12,000 by the mid-2010s, and those smaller birth cohorts have been working their way through the school system ever since.
The graduating class reflects birth rates from roughly 18 years earlier. The Class of 2025 was born in 2006-2007, near the tail end of a period when births were still relatively high. Classes entering high school now reflect the lower birth rates of 2010-2012, suggesting the cohort decline has several more years to run.
More Money Per Student, Fewer Students Total
The fiscal implications are inescapable. Per-pupil adequacy funding reached a record $7,132 in fiscal year 2025, a 30 percent increase over the past decade, driven in significant part by the denominator shrinking. Fixed costs — buildings, administration, transportation routes — do not scale downward in proportion to enrollment. A school built for 500 students does not cost half as much to operate when enrollment falls to 250.
For communities that fund schools primarily through property taxes, the math creates pressure in both directions. Fewer students means higher per-pupil costs, but also fewer families with school-age children among the voters deciding budgets. The political economy of school funding shifts when the school-age population becomes a smaller share of the overall community.
Where the Shrinkage Is Worst
The cohort decline is not evenly distributed. Among districts large enough to track over a decade, the largest absolute declines have come from the biggest cities — Manchester↗ET, Nashua↗ET, and Concord↗ET — which have lost hundreds of graduates from their annual cohorts. But the sharpest percentage declines have hit smaller districts in the North Country and rural communities where a declining cohort can mean the difference between offering a full slate of courses and not.
Some districts are growing against the trend, primarily charter and alternative programs that draw from across district boundaries. But the overall trajectory is unmistakable: each year's graduating class is smaller than the last.
The Graduation Rate Illusion
The shrinking cohort interacts with graduation rates in a way that can mask the full picture. When commentators note that New Hampshire's graduation rate has held roughly steady over the decade — 88.1 percent in 2015, 87.5 percent in 2025 — they are describing a ratio that conceals the numerator's decline.
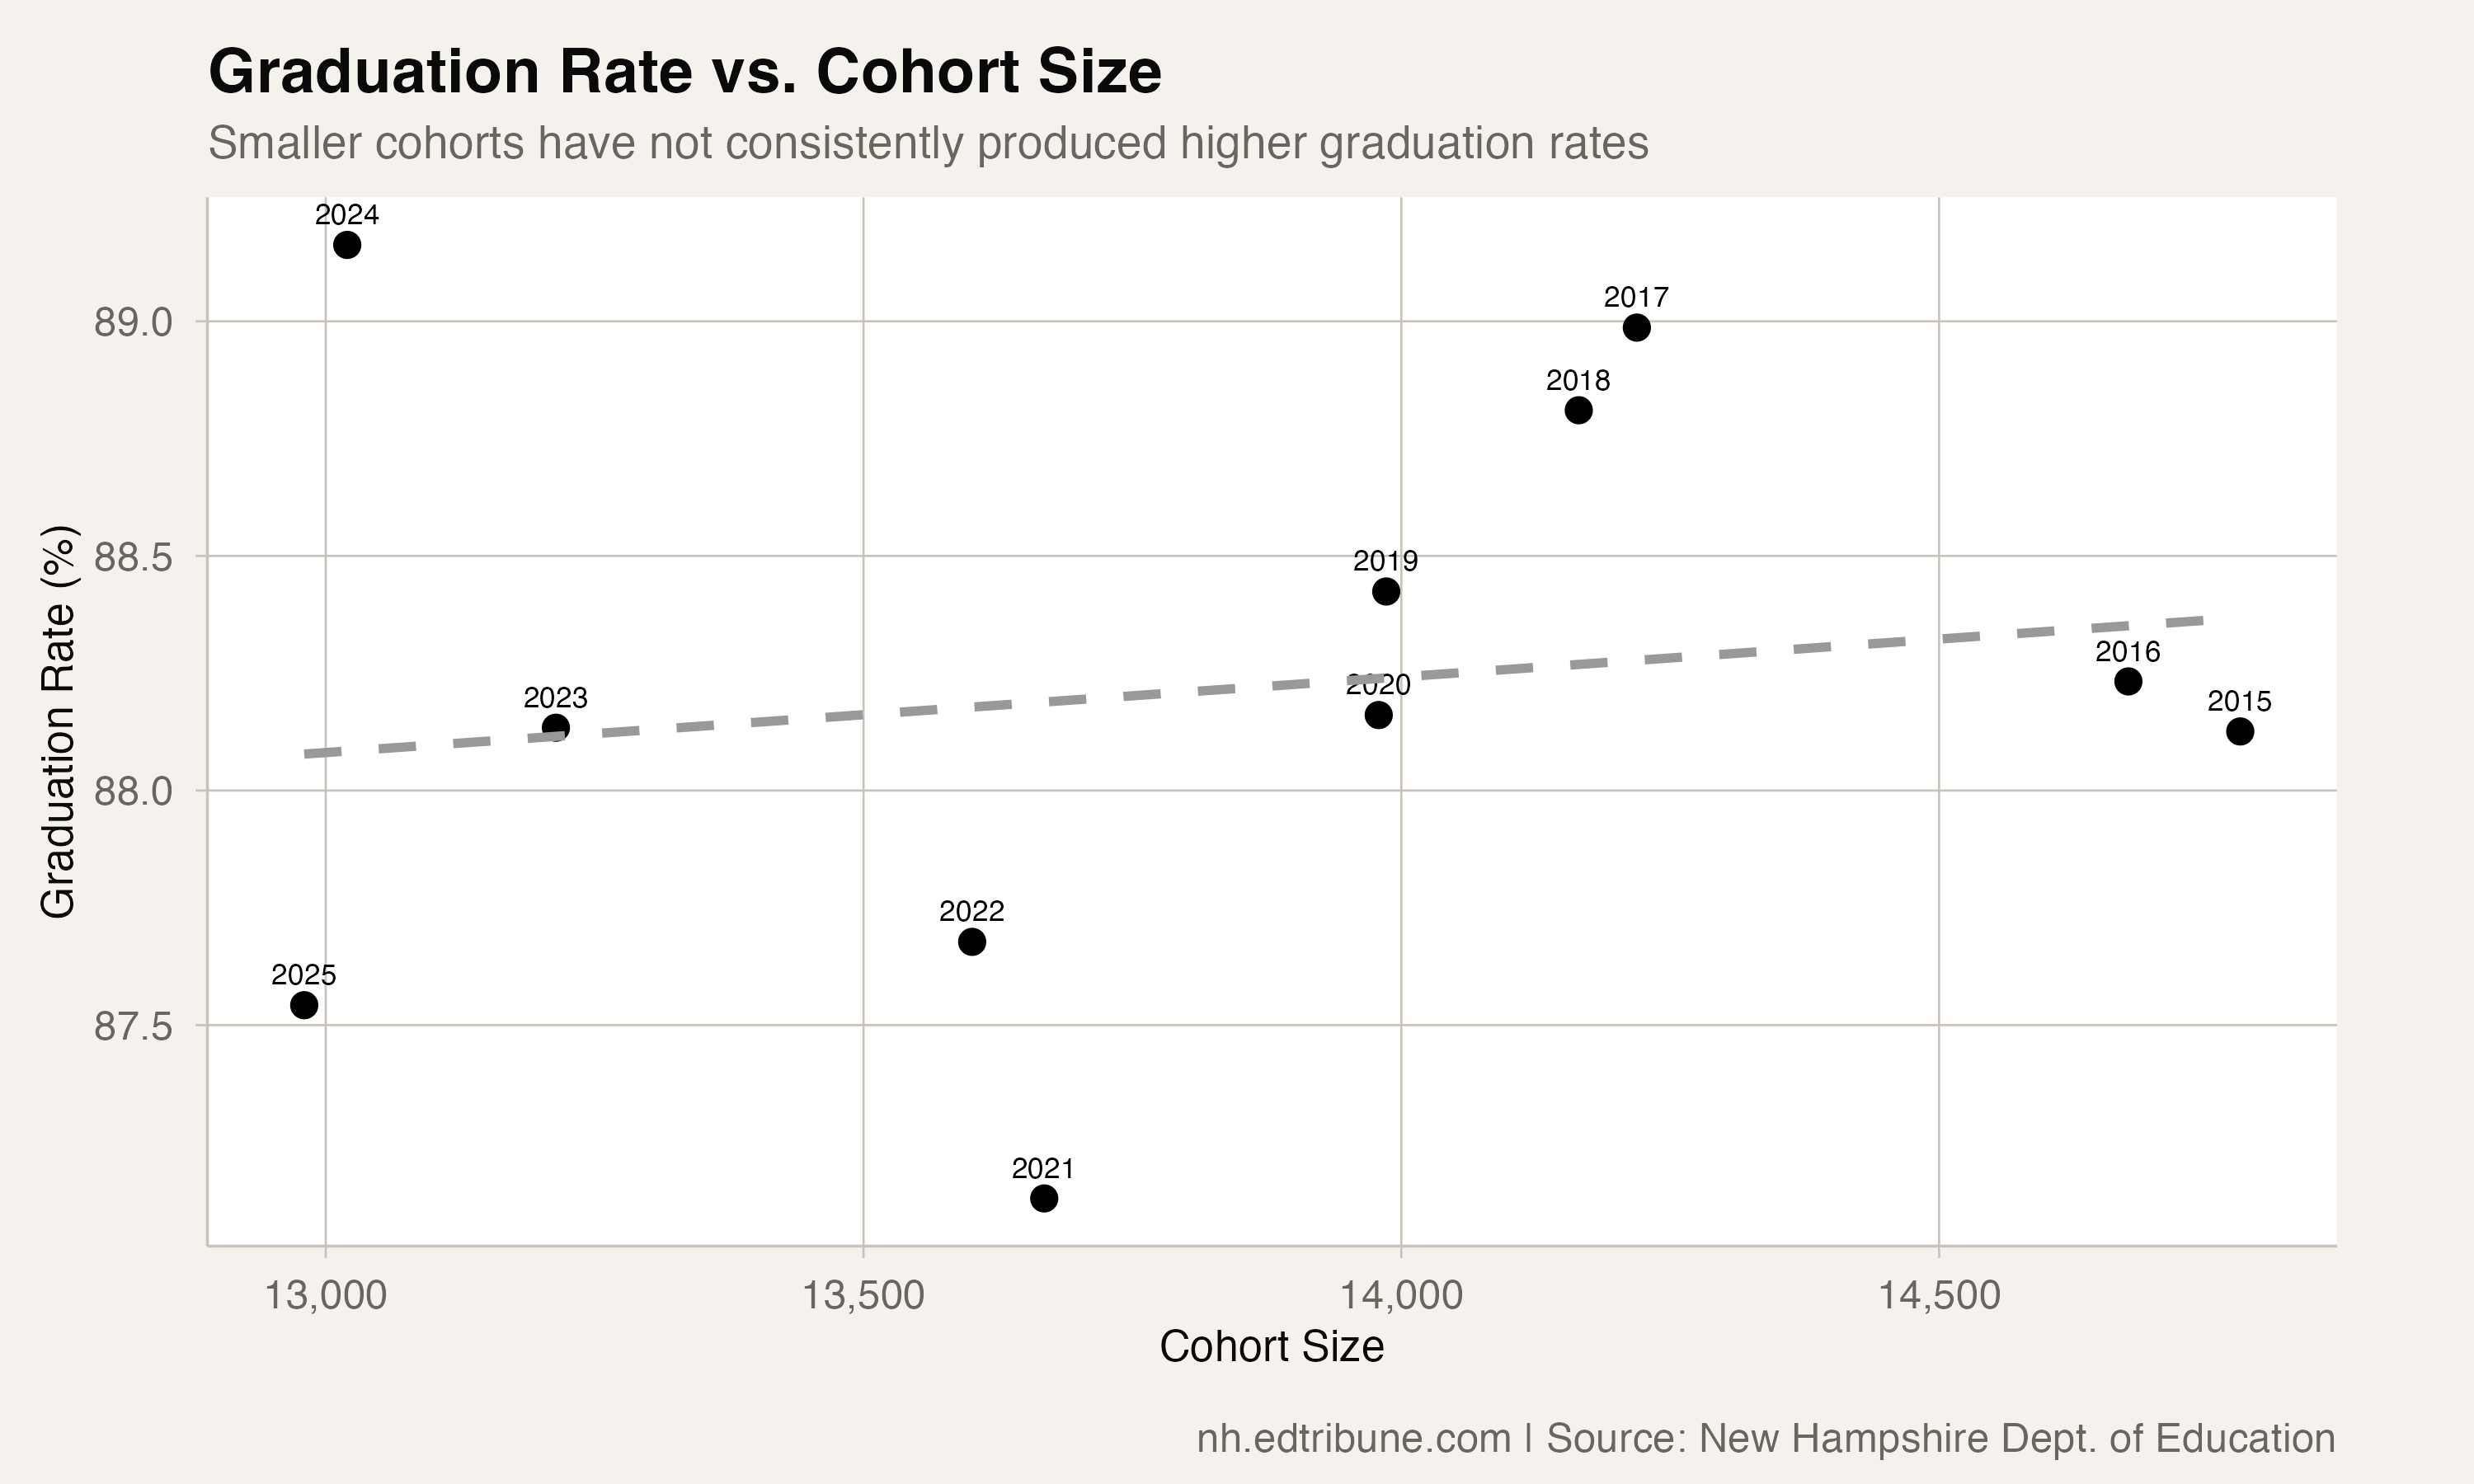
The state graduated 13,025 students in 2015 and 11,363 in 2025. That is 1,662 fewer young adults entering the workforce, enrolling in college, or launching careers each year. A steady graduation rate applied to a shrinking base produces a shrinking output — and it is the output, not the rate, that determines how many workers, taxpayers, and community members the education system is producing.
The question New Hampshire faces is whether a graduation rate hovering near 88 percent is acceptable when the absolute number of graduates has fallen 12.7 percent and shows no sign of bottoming out. At current trends, the cohort could fall below 12,000 within the next few years, pushing the state's annual graduate output below 10,500 — a level not seen in modern memory.
The New Hampshire Department of Education did not respond to a request for comment.
Data Source
This analysis uses four-year adjusted cohort graduation rate data from the New Hampshire Department of Education, covering the graduating classes of 2015 through 2025. Cohort counts represent the adjusted four-year graduation cohort.
Detailed code that reproduces the analysis and figures in this article is available exclusively to EdTribune subscribers.
Discussion
Sign in to join the discussion.
Loading comments...