Manchester↗ET, the district New Hampshire has spent a generation worrying about, is doing something it has almost never done: getting better.
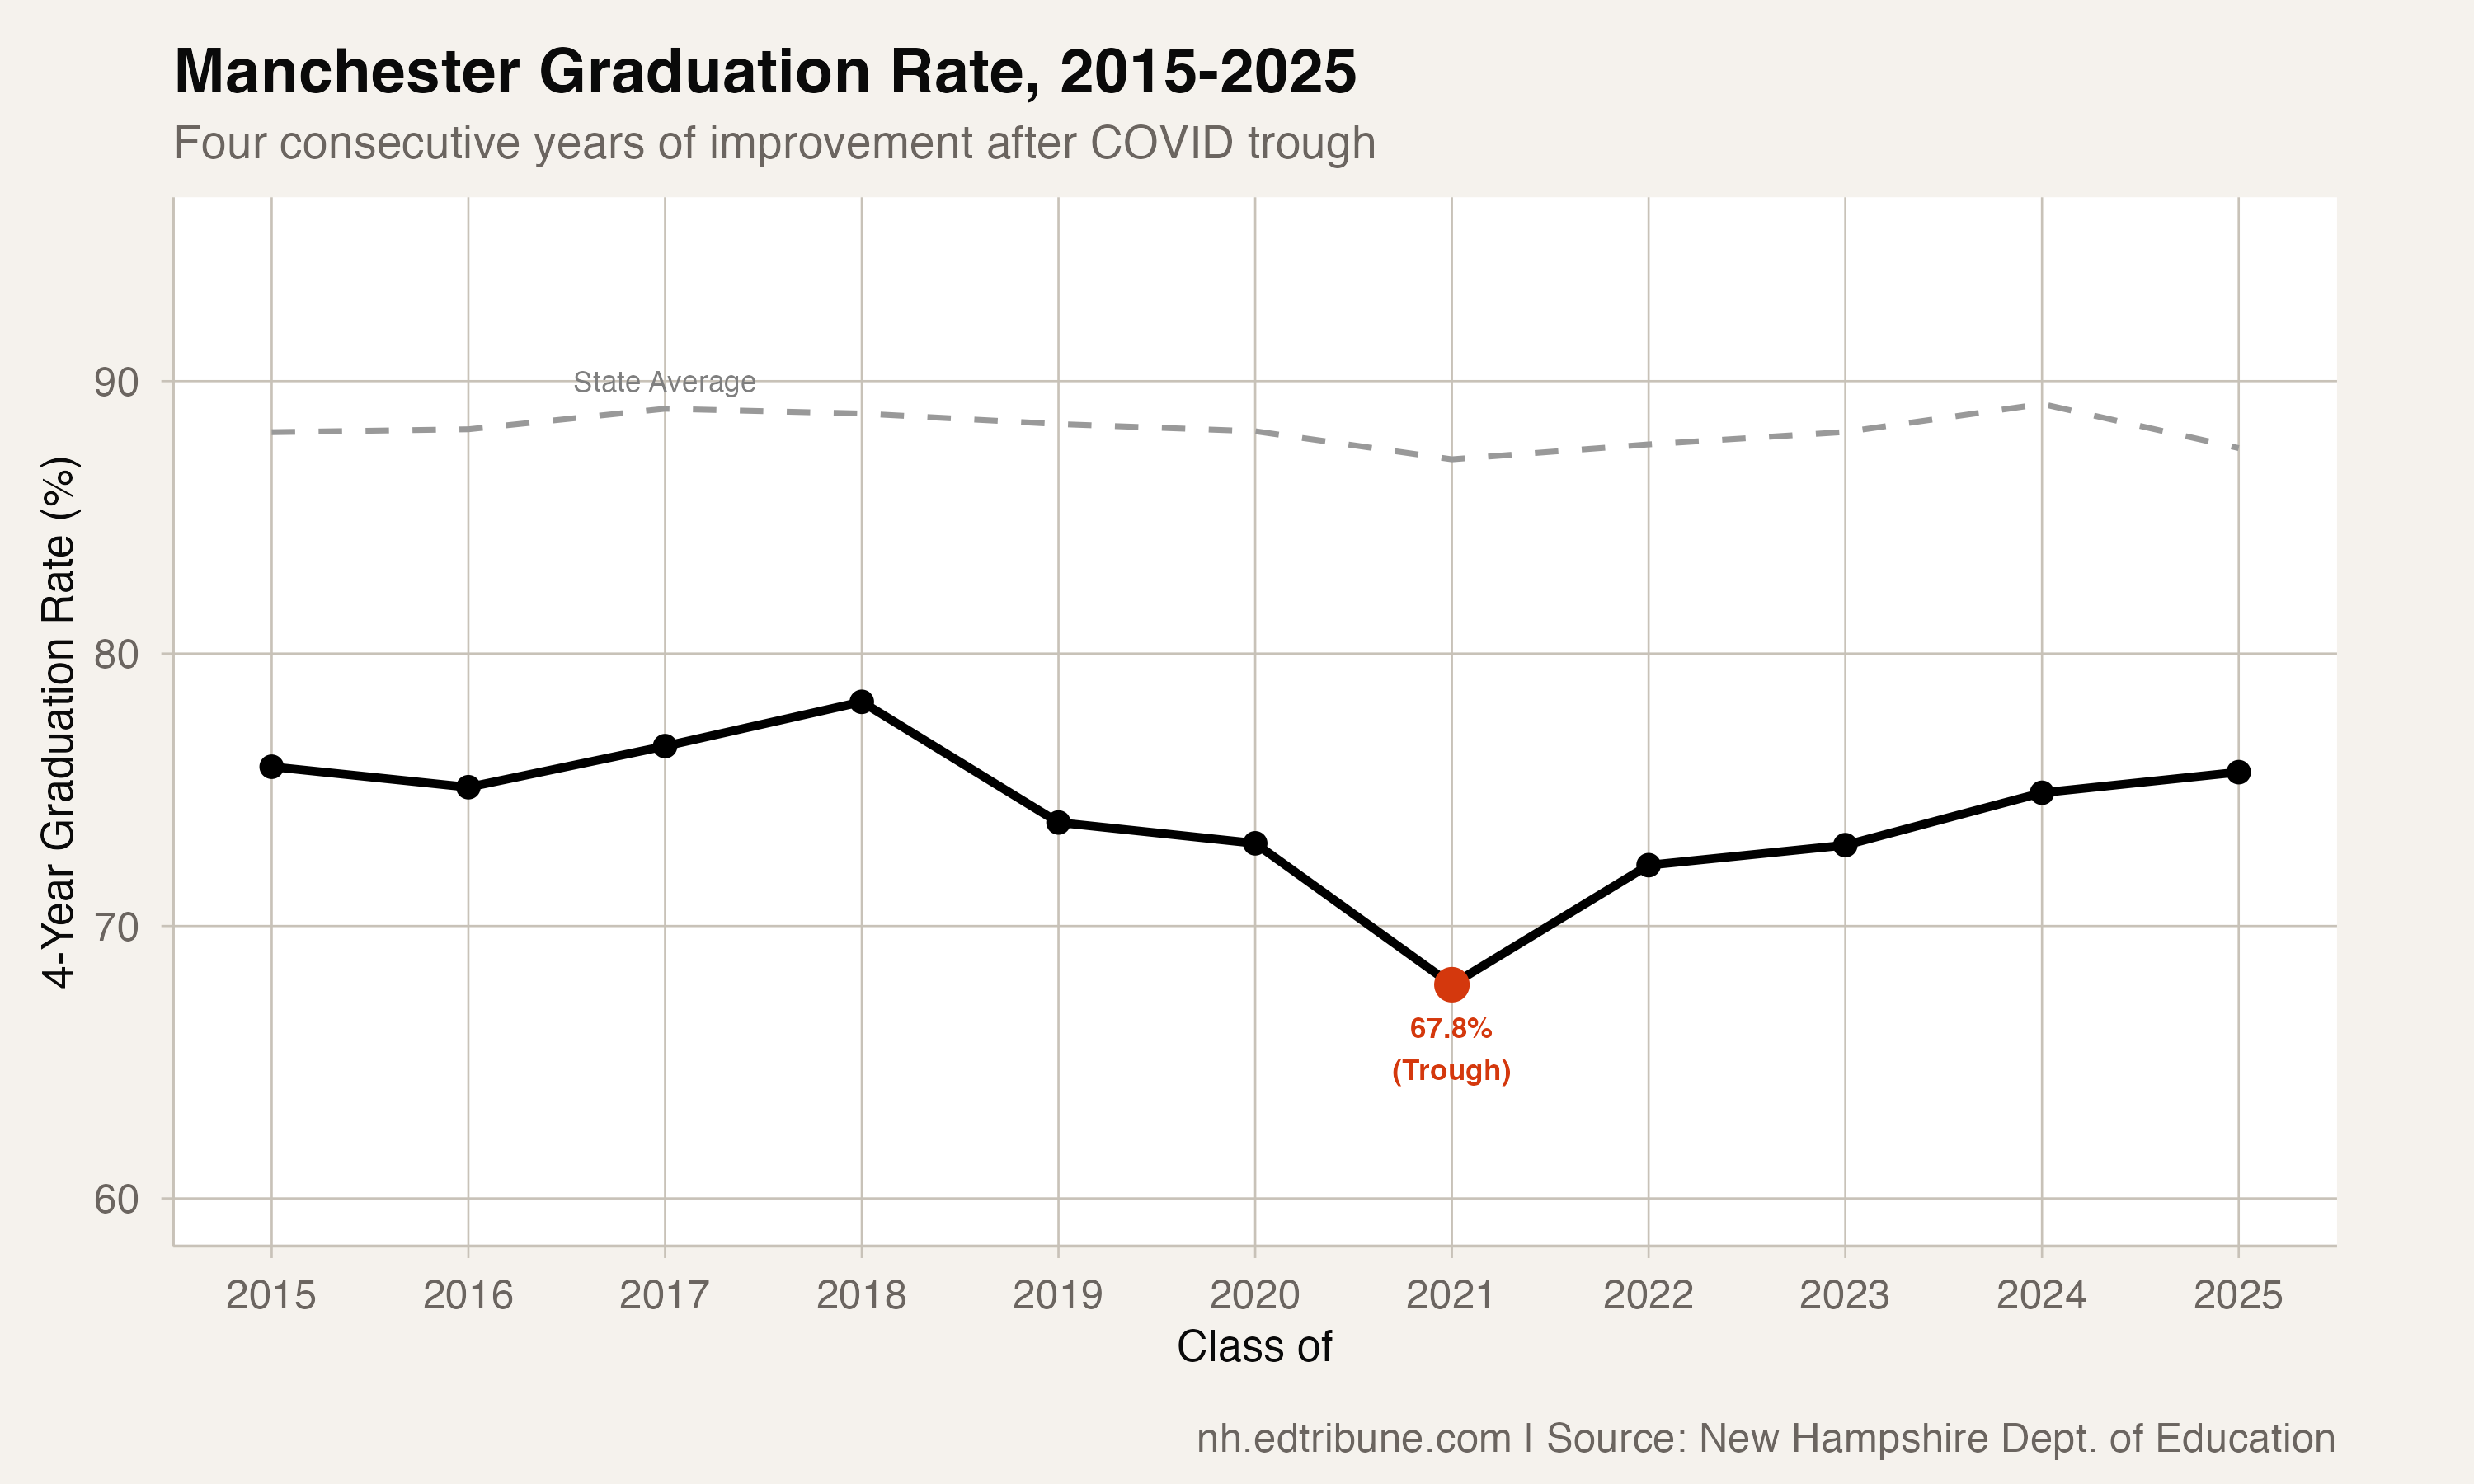
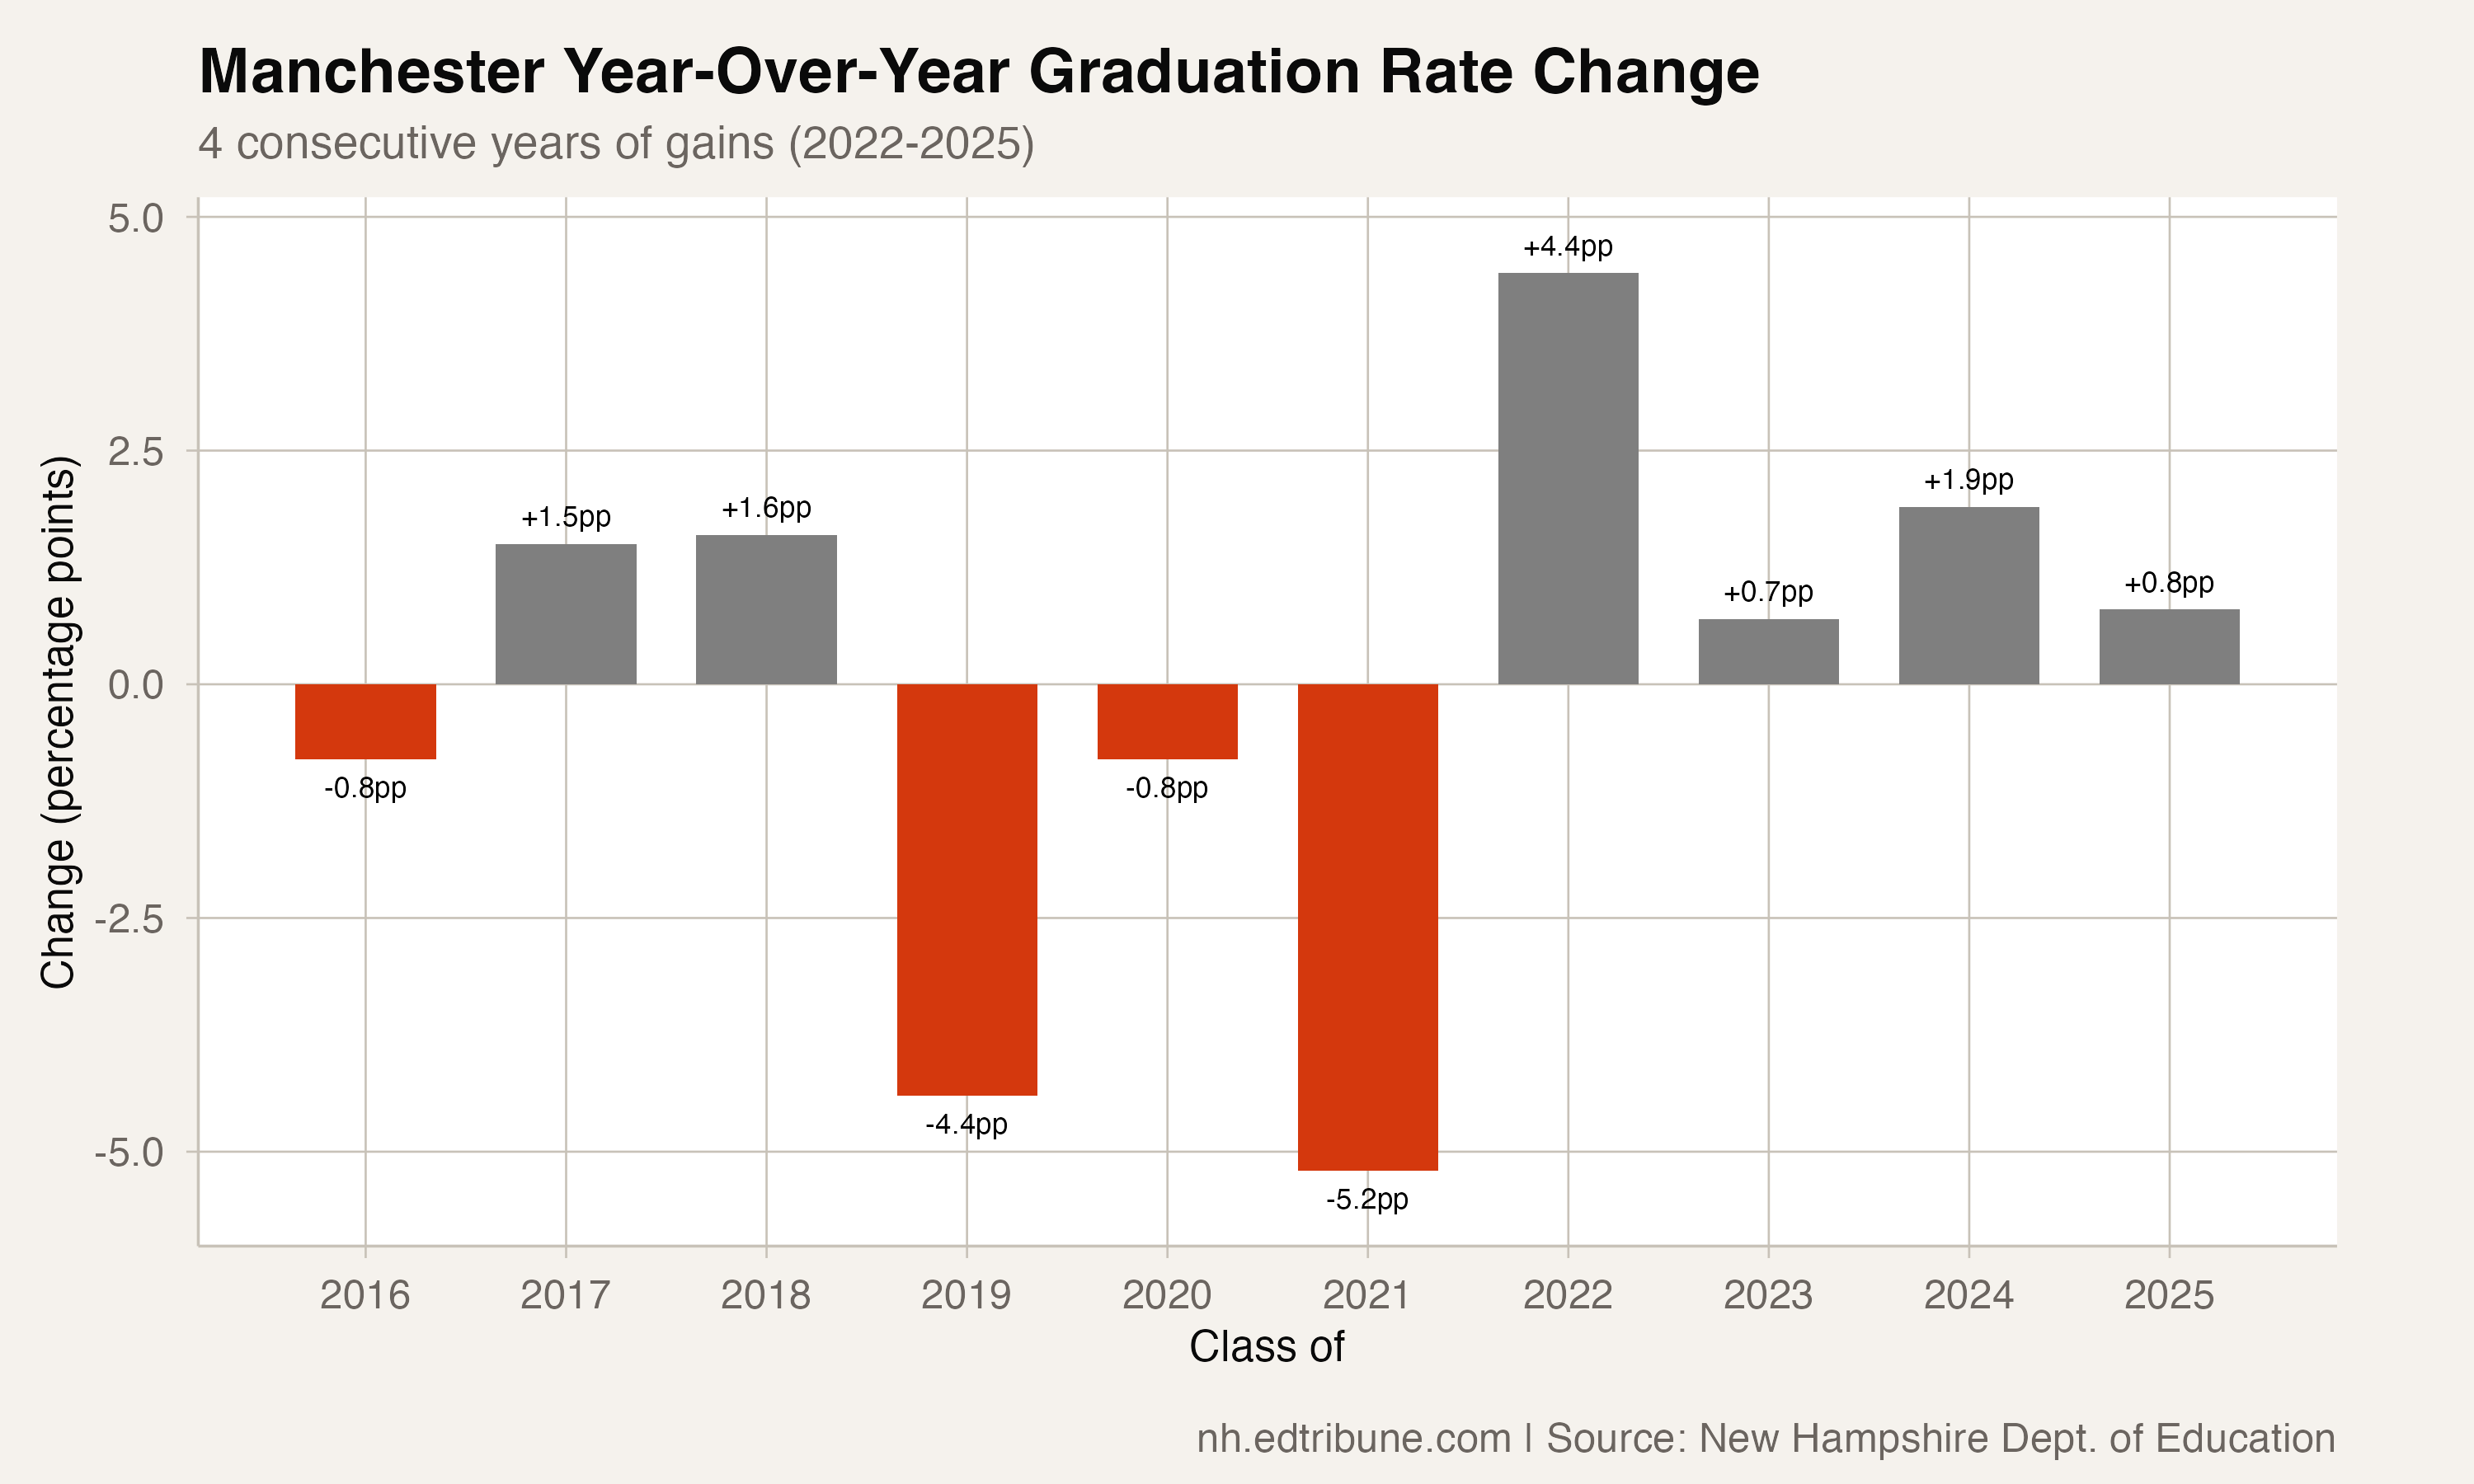
The state's largest city graduated 75.6 percent of its Class of 2025 — the fourth consecutive year of improvement and the culmination of a climb from the 67.8 percent trough posted by the Class of 2021. That 7.8 percentage-point gain over four years is the longest active improvement streak of any large district in the state.
The timing makes it more remarkable. Manchester improved in 2025 while the statewide rate crashed 1.6 points. It improved while Concord↗ET, the capital, dropped to 73.0 percent. It improved while 20 districts hit all-time lows.
Where Manchester Started
To appreciate the 2025 number, you have to understand how deep the hole was. Manchester has been New Hampshire's lowest-performing large district for as long as the data exists. In 2015, its 75.8 percent graduation rate trailed the state average by more than 12 points. When COVID hit, the rate cratered: 70.2 percent for the Class of 2020, then 67.8 percent for the Class of 2021 — meaning one in three Manchester students did not graduate on time.
The four-year recovery has been steady rather than dramatic: 72.1 percent in 2022, 73.5 percent in 2023, 74.2 percent in 2024, and 75.6 percent in 2025. Each step was a small gain — 1 to 4 points — but the consistency matters. Manchester has not posted four consecutive increases at any other point in the dataset.
What Hasn't Changed
The progress is real, but the context tempers it. Manchester's 2025 rate of 75.6 percent is essentially the same as its 2015 rate of 75.8 percent. After a decade that included a collapse and a recovery, the district ended up back where it started.
And the dropout rate remains stubbornly high. Manchester posted an 11.4 percent dropout rate in 2025 — five times the state average and the highest among large districts by a wide margin. Over 11 years, Manchester has never recorded a dropout rate below 8.4 percent, and it has exceeded 10 percent in eight of those years. In raw numbers, 110 Manchester students dropped out of the Class of 2025, roughly one-third of all dropouts statewide from a single district.
When combined with the 75.6 percent graduation rate and the 11.4 percent dropout rate, about 13 percent of Manchester's cohort falls into the "unaccounted" category — still enrolled, transferred, or pursuing alternative credentials. That is higher than the state's 10.3 percent but lower than some might expect given the district's challenges.
Manchester Among Its Peers
The 2025 results reshuffled the hierarchy among New Hampshire's cities. Manchester, historically at the bottom, now outperforms Concord (73.0 percent). Nashua↗ET, long viewed as Manchester's more successful neighbor, has closed from a 14-point advantage in 2015 to just 7 points.
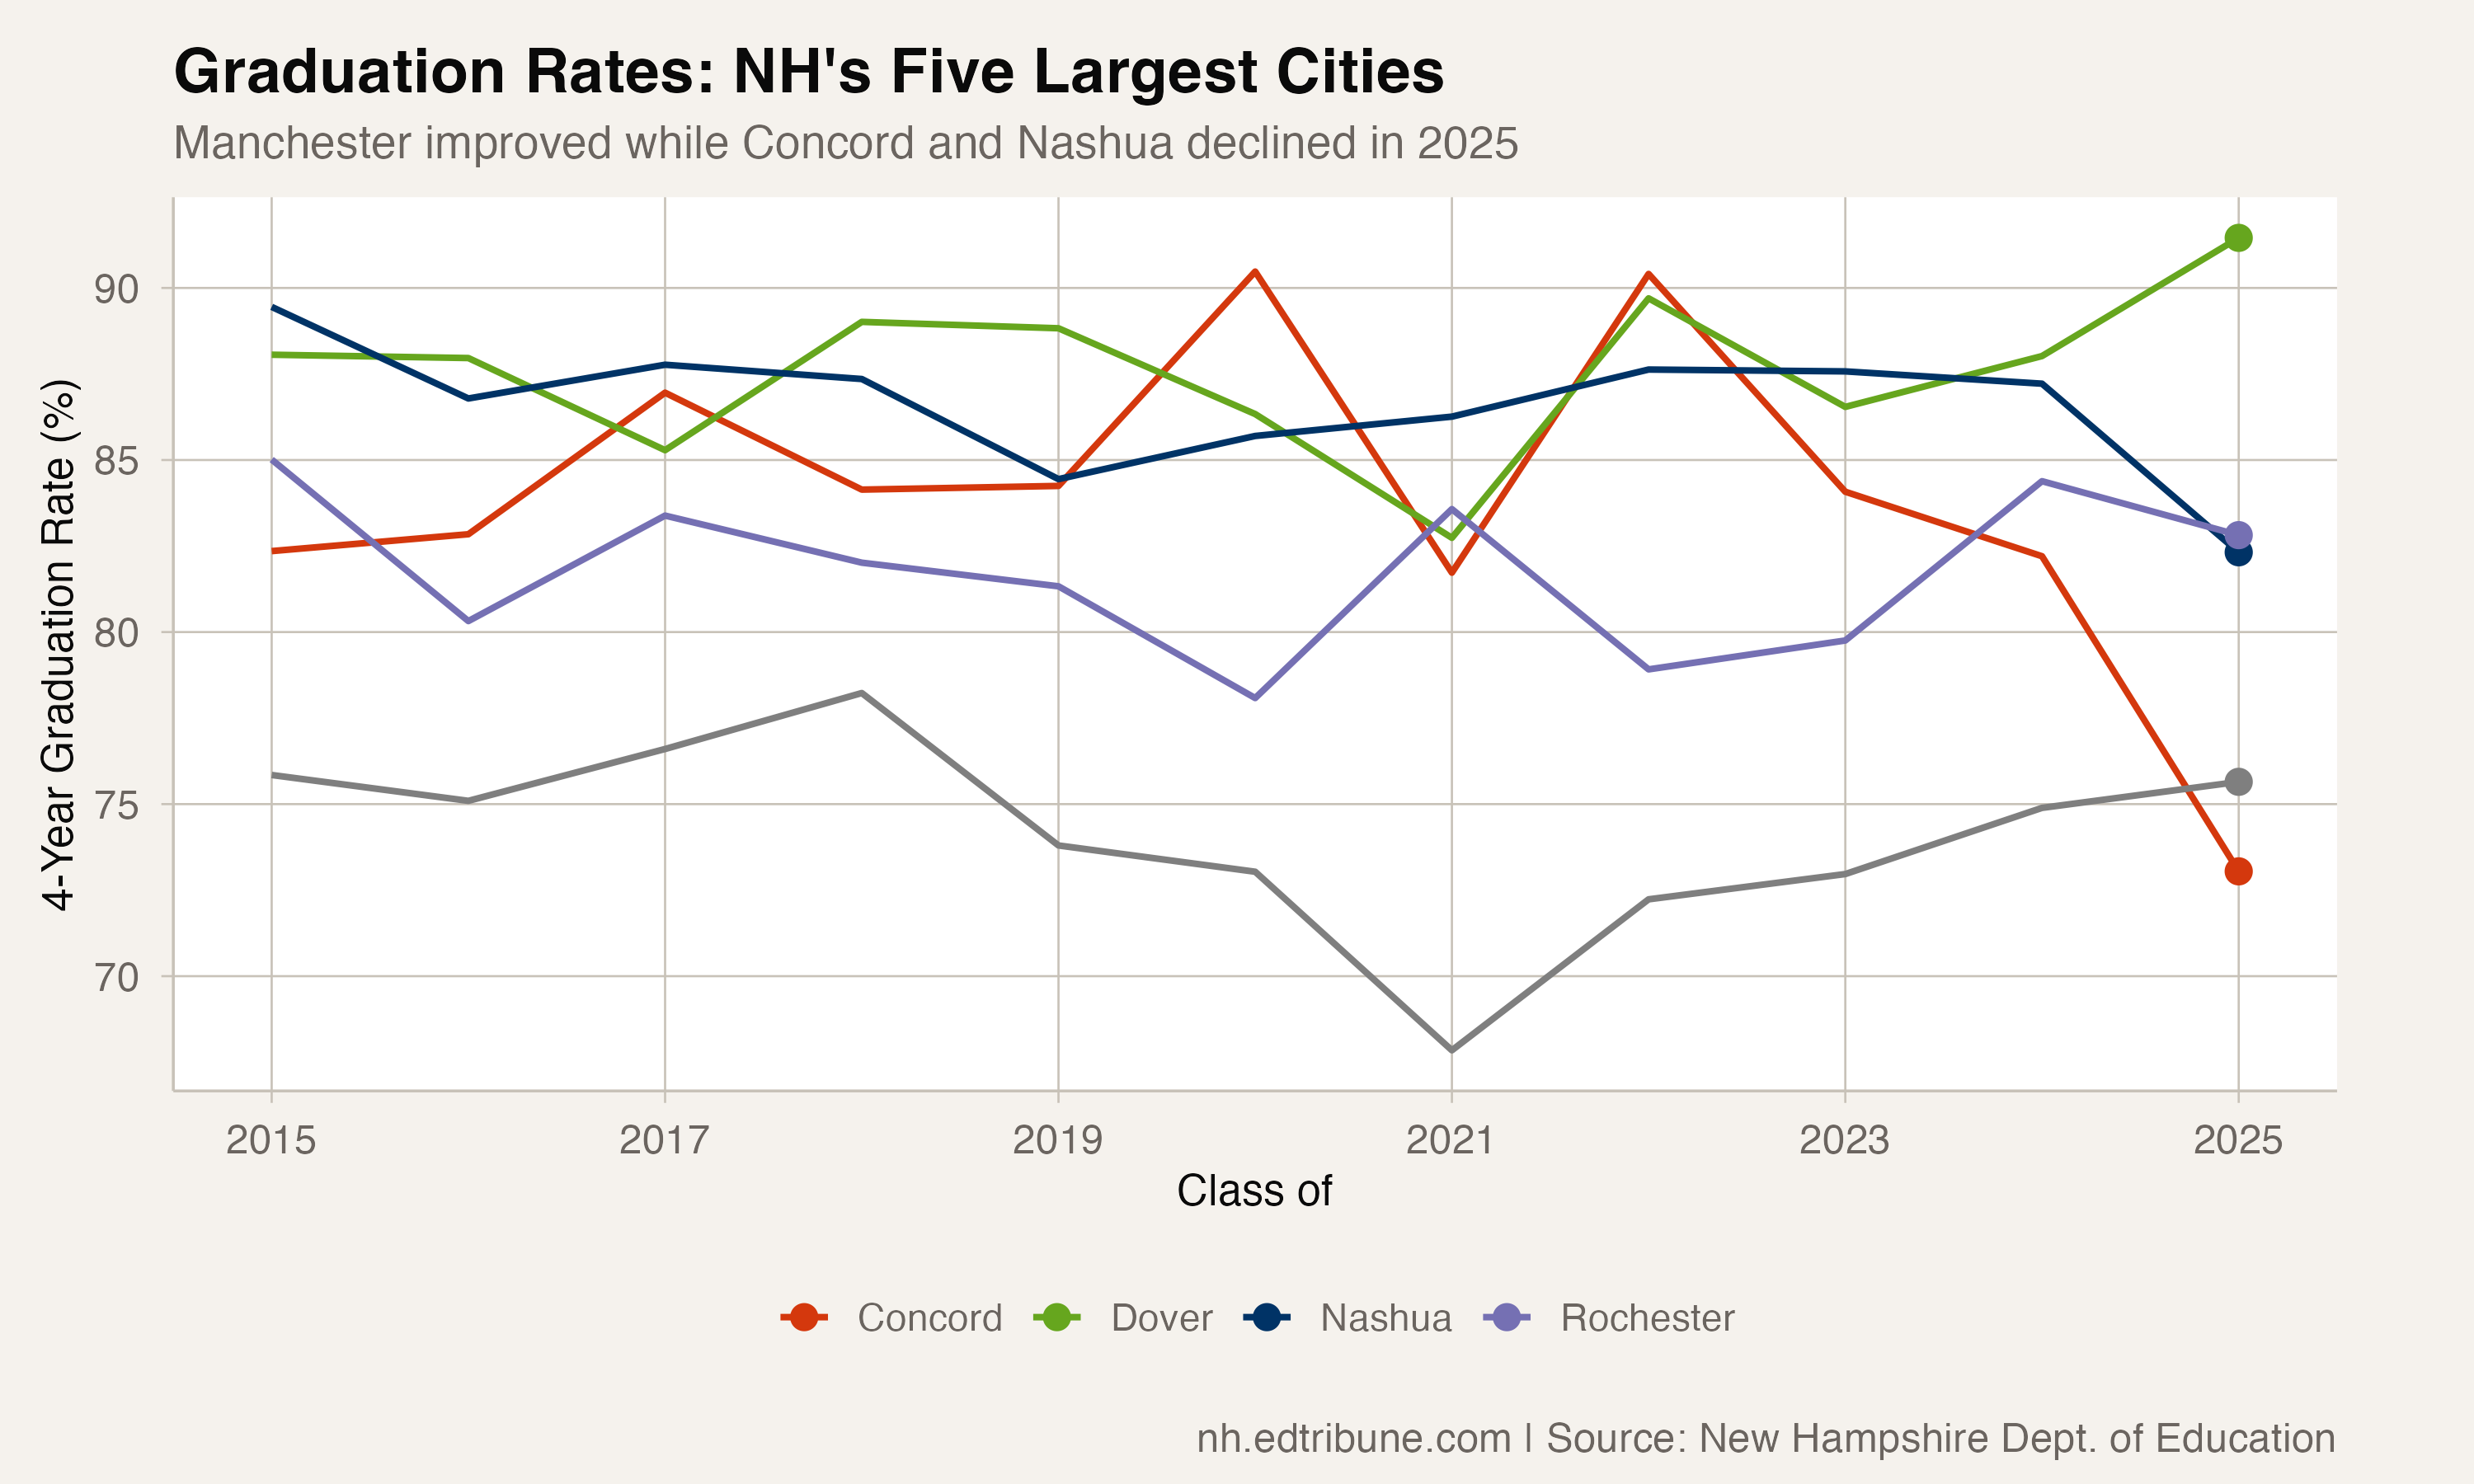
Meanwhile, Dover↗ET surged to an all-time high of 91.5 percent, opening a 16-point gap over Manchester. Rochester↗ET held steady at 82.8 percent. The variation among cities of similar size — from Dover's 91.5 to Manchester's 75.6 — shows how much local context matters in a small state where all five cities share the same funding formula.
A 965-Student Challenge
Manchester's graduating cohort of 965 students is the largest in the state — bigger than Nashua (854), Pinkerton Academy↗ET (742), or Concord (371). In a state where many districts graduate fewer than 100 students, the scale of Manchester's challenge is different in kind.
With 965 students in the cohort, even a 1-point improvement means roughly 10 additional students crossing the stage. The four-year improvement of 7.8 points translates to approximately 75 more students graduating than the 2021 rate would have produced. Whether those additional graduates found their way through credit recovery, extended learning, or simply more effective supports, the district is reaching students it was losing just four years ago.
Manchester did not respond to a request for comment.
Data Source
This analysis uses four-year adjusted cohort graduation rate data from the New Hampshire Department of Education, covering the graduating classes of 2015 through 2025.
Detailed code that reproduces the analysis and figures in this article is available exclusively to EdTribune subscribers.
Discussion
Sign in to join the discussion.
Loading comments...