Correction: This article has been updated to fix several data errors in the original version, including Dover's 2019 graduation rate, the count of districts at all-time lows, dropout rate history, and comparisons to the state average.
In a year when 21 New Hampshire districts hit all-time low graduation rates, Dover↗ET went the other direction.
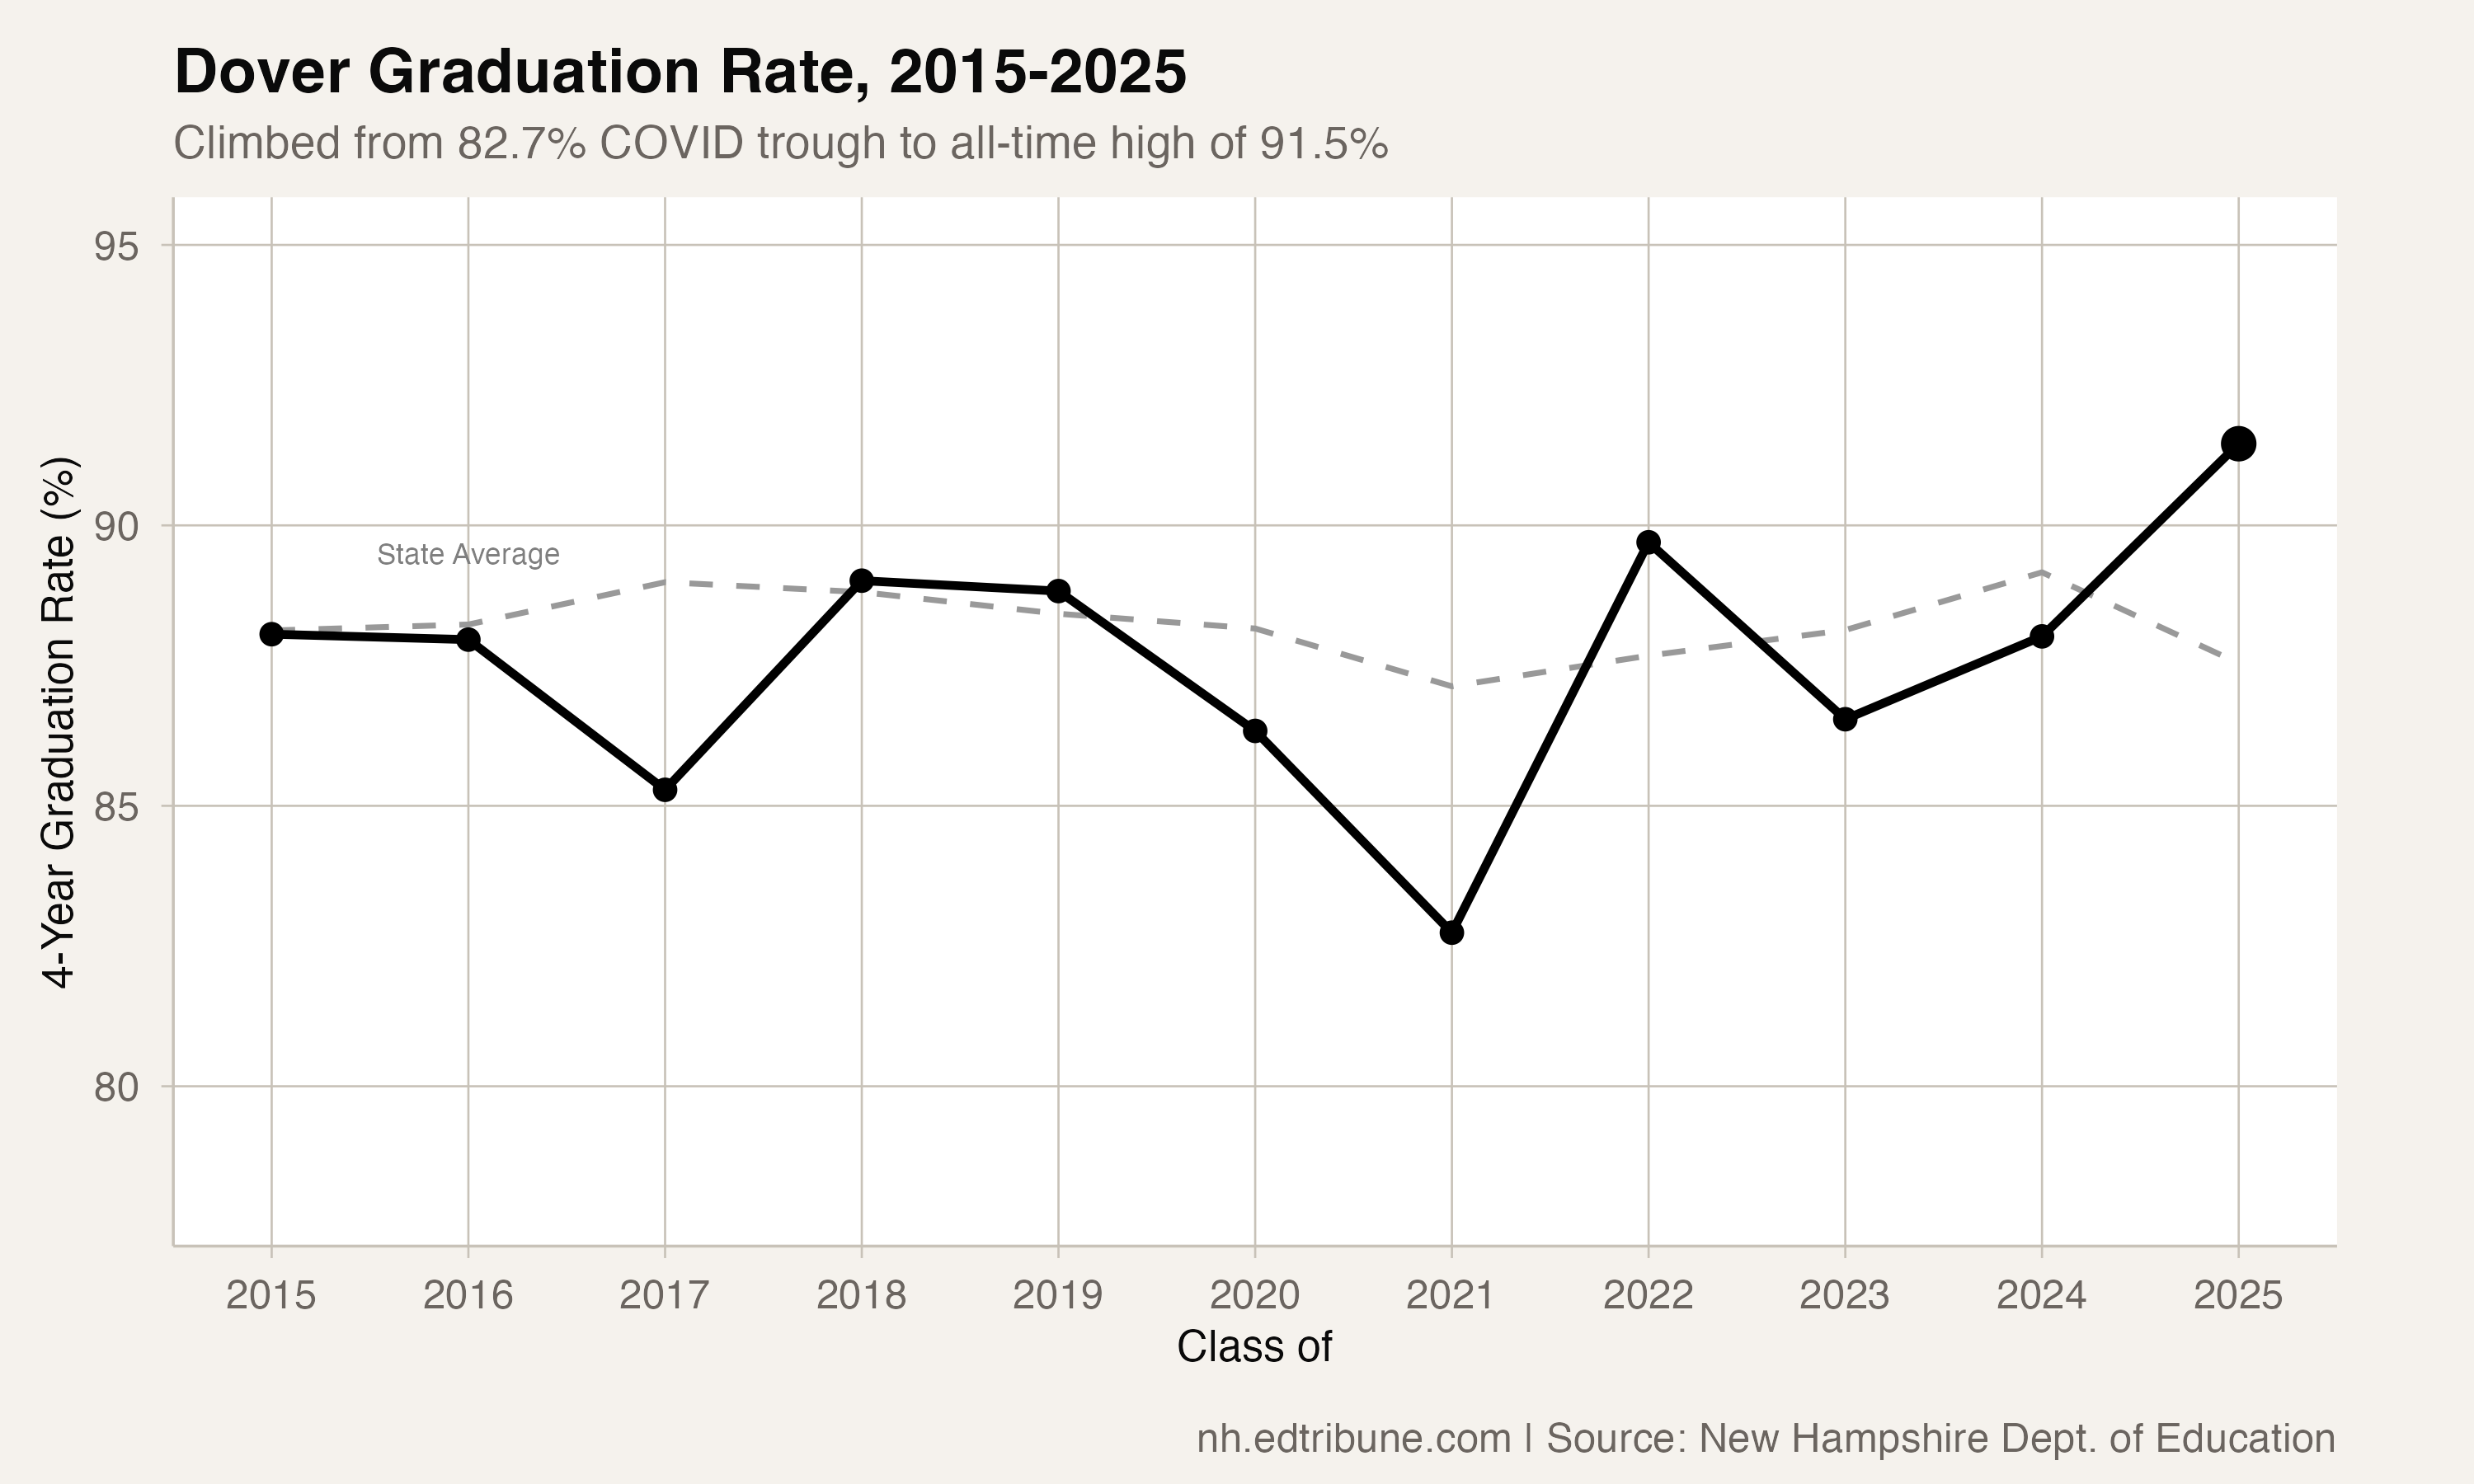
The Seacoast city graduated 91.5 percent of its Class of 2025 — an all-time high in at least 11 years of data and the highest rate ever recorded by a district with more than 300 students in the cohort. Dover is the only district with a cohort above 300 to set a graduation record in 2025, a year that otherwise belonged to declines.
From COVID Trough to Record
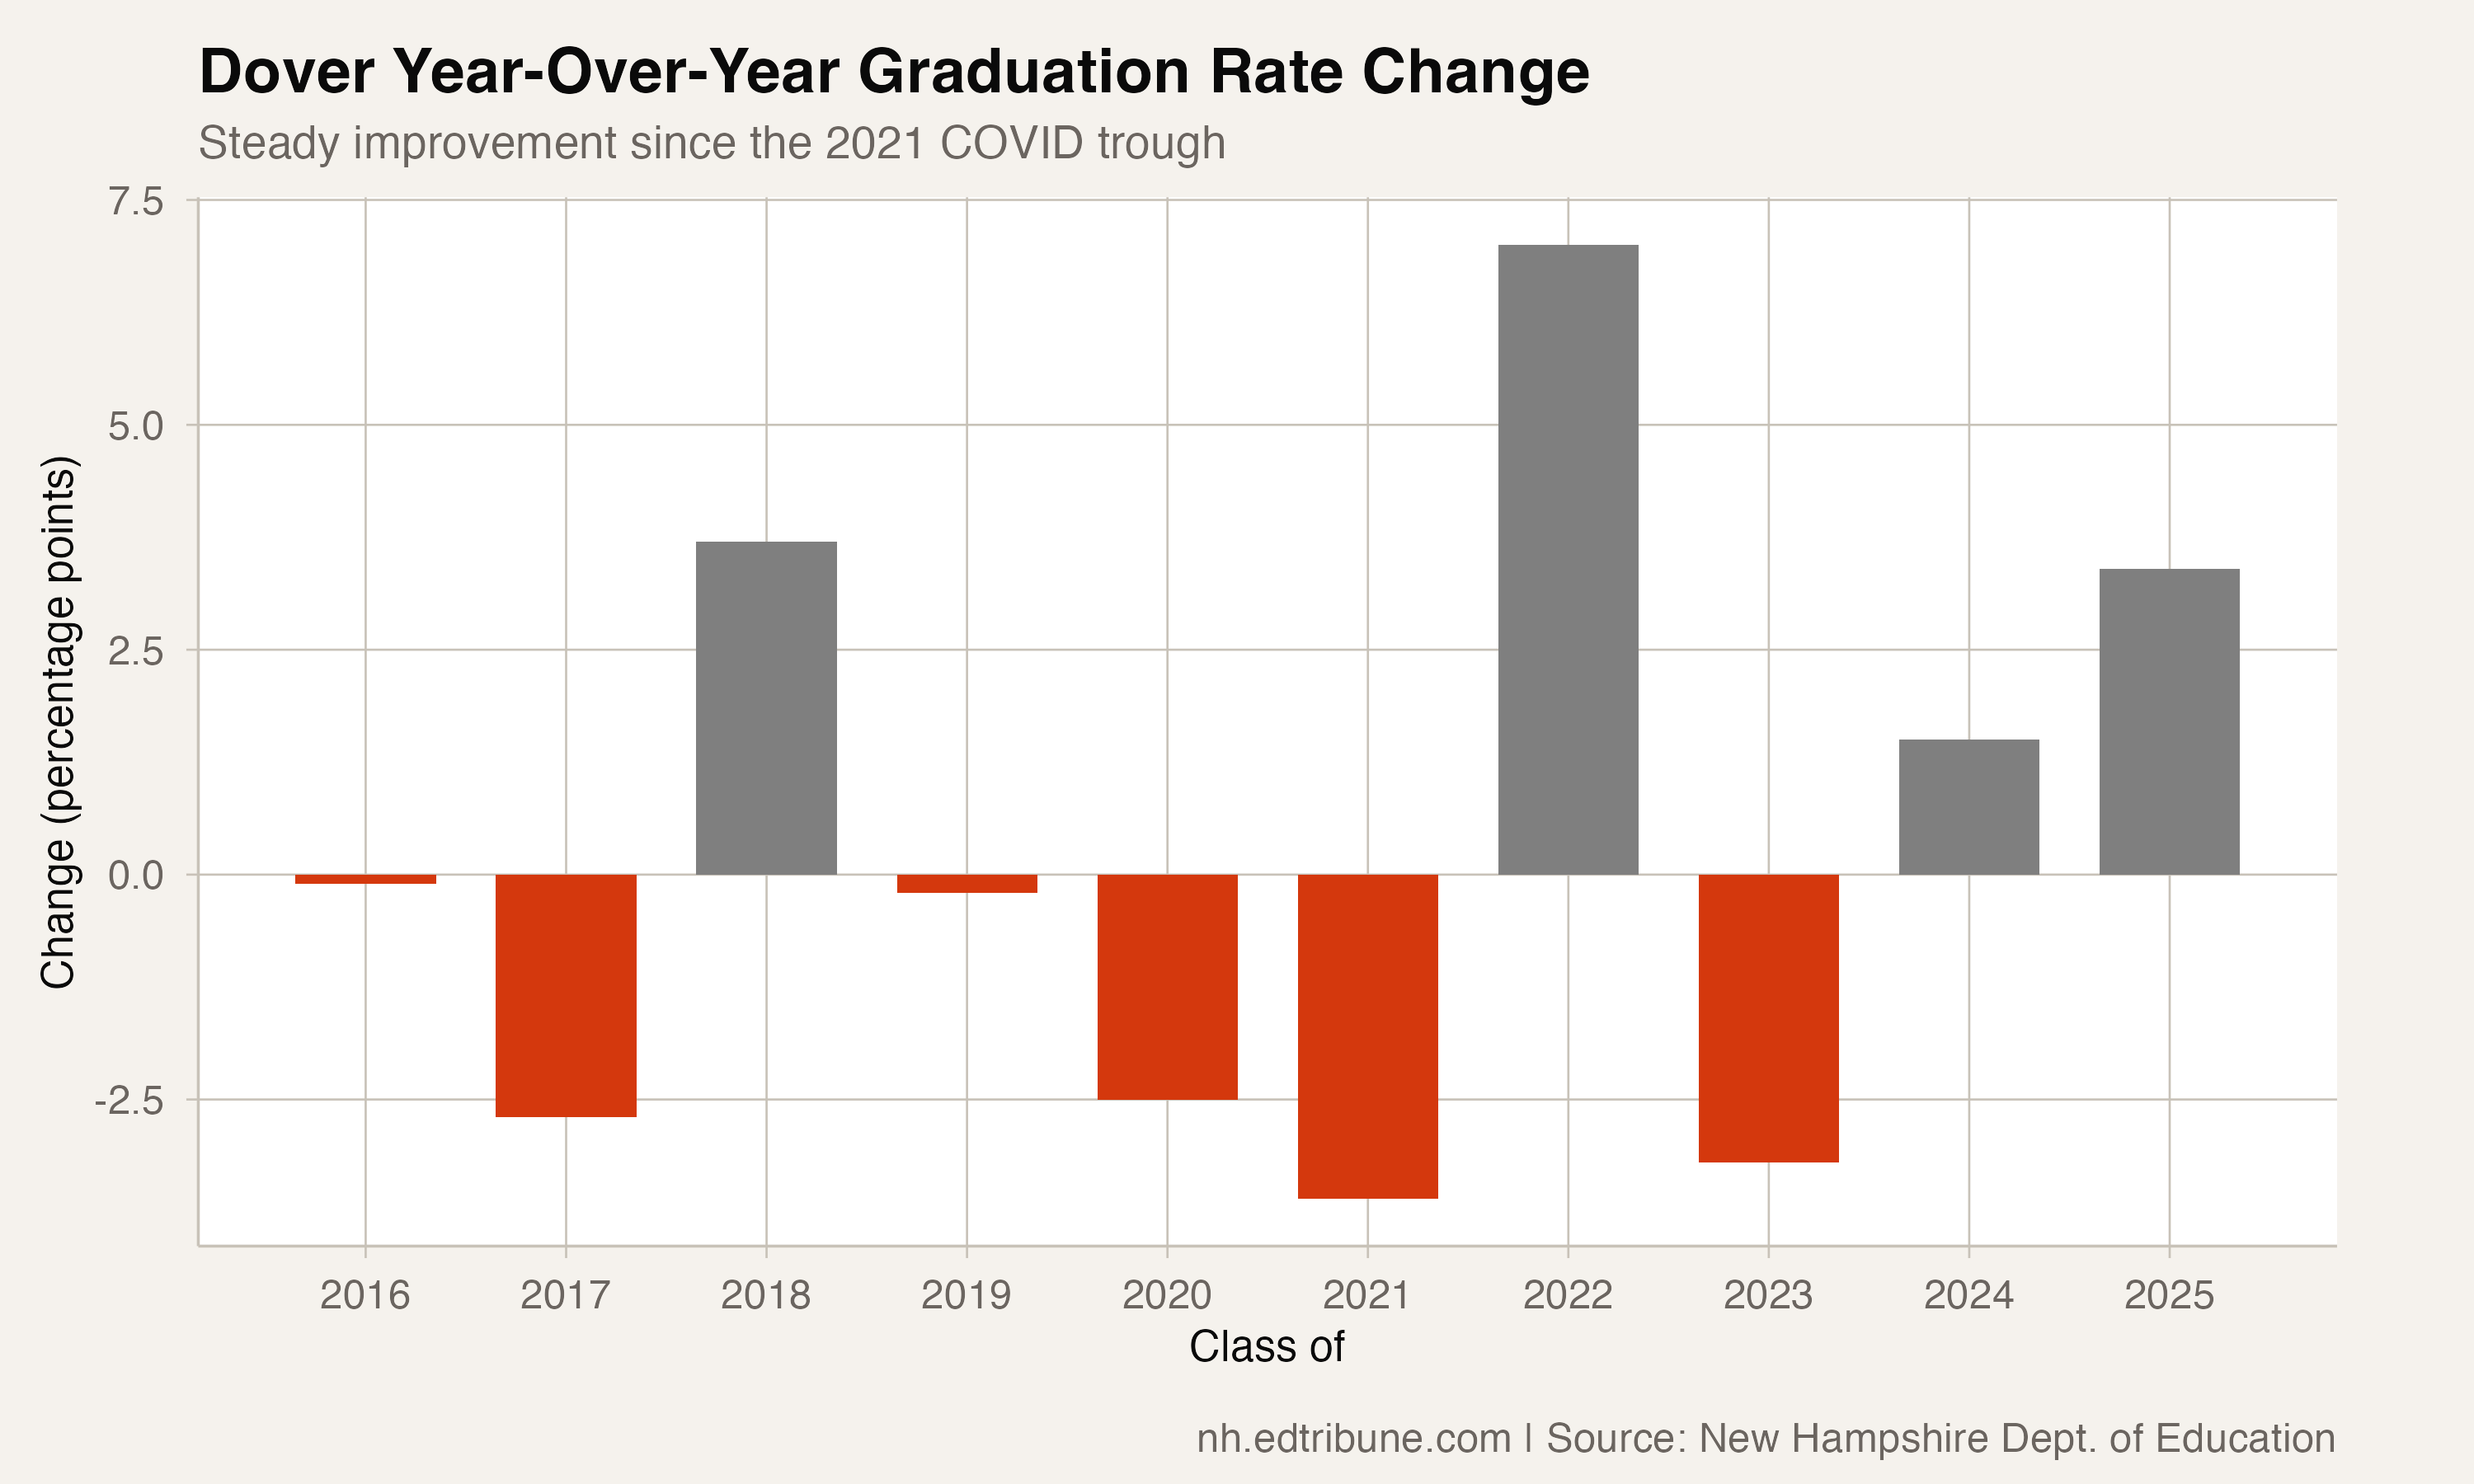
Dover's trajectory tells a clean story of recovery. The district posted an 88.1 percent rate in 2015, climbed to 89.0 in 2018, then dropped to 82.7 percent in 2021 as COVID disrupted the Class of 2021's final two years. Since that trough, the recovery has been nearly unbroken: 89.7 percent in 2022, a dip to 86.5 in 2023, then 88.0 in 2024, and the record 91.5 in 2025.
The 8.7-point climb from the 2021 trough is the largest COVID-era recovery of any district with a cohort above 200 students. And unlike districts where a single good year can be attributed to cohort composition, Dover's improvement has been sustained across multiple graduating classes.
Dover Among Its Peers
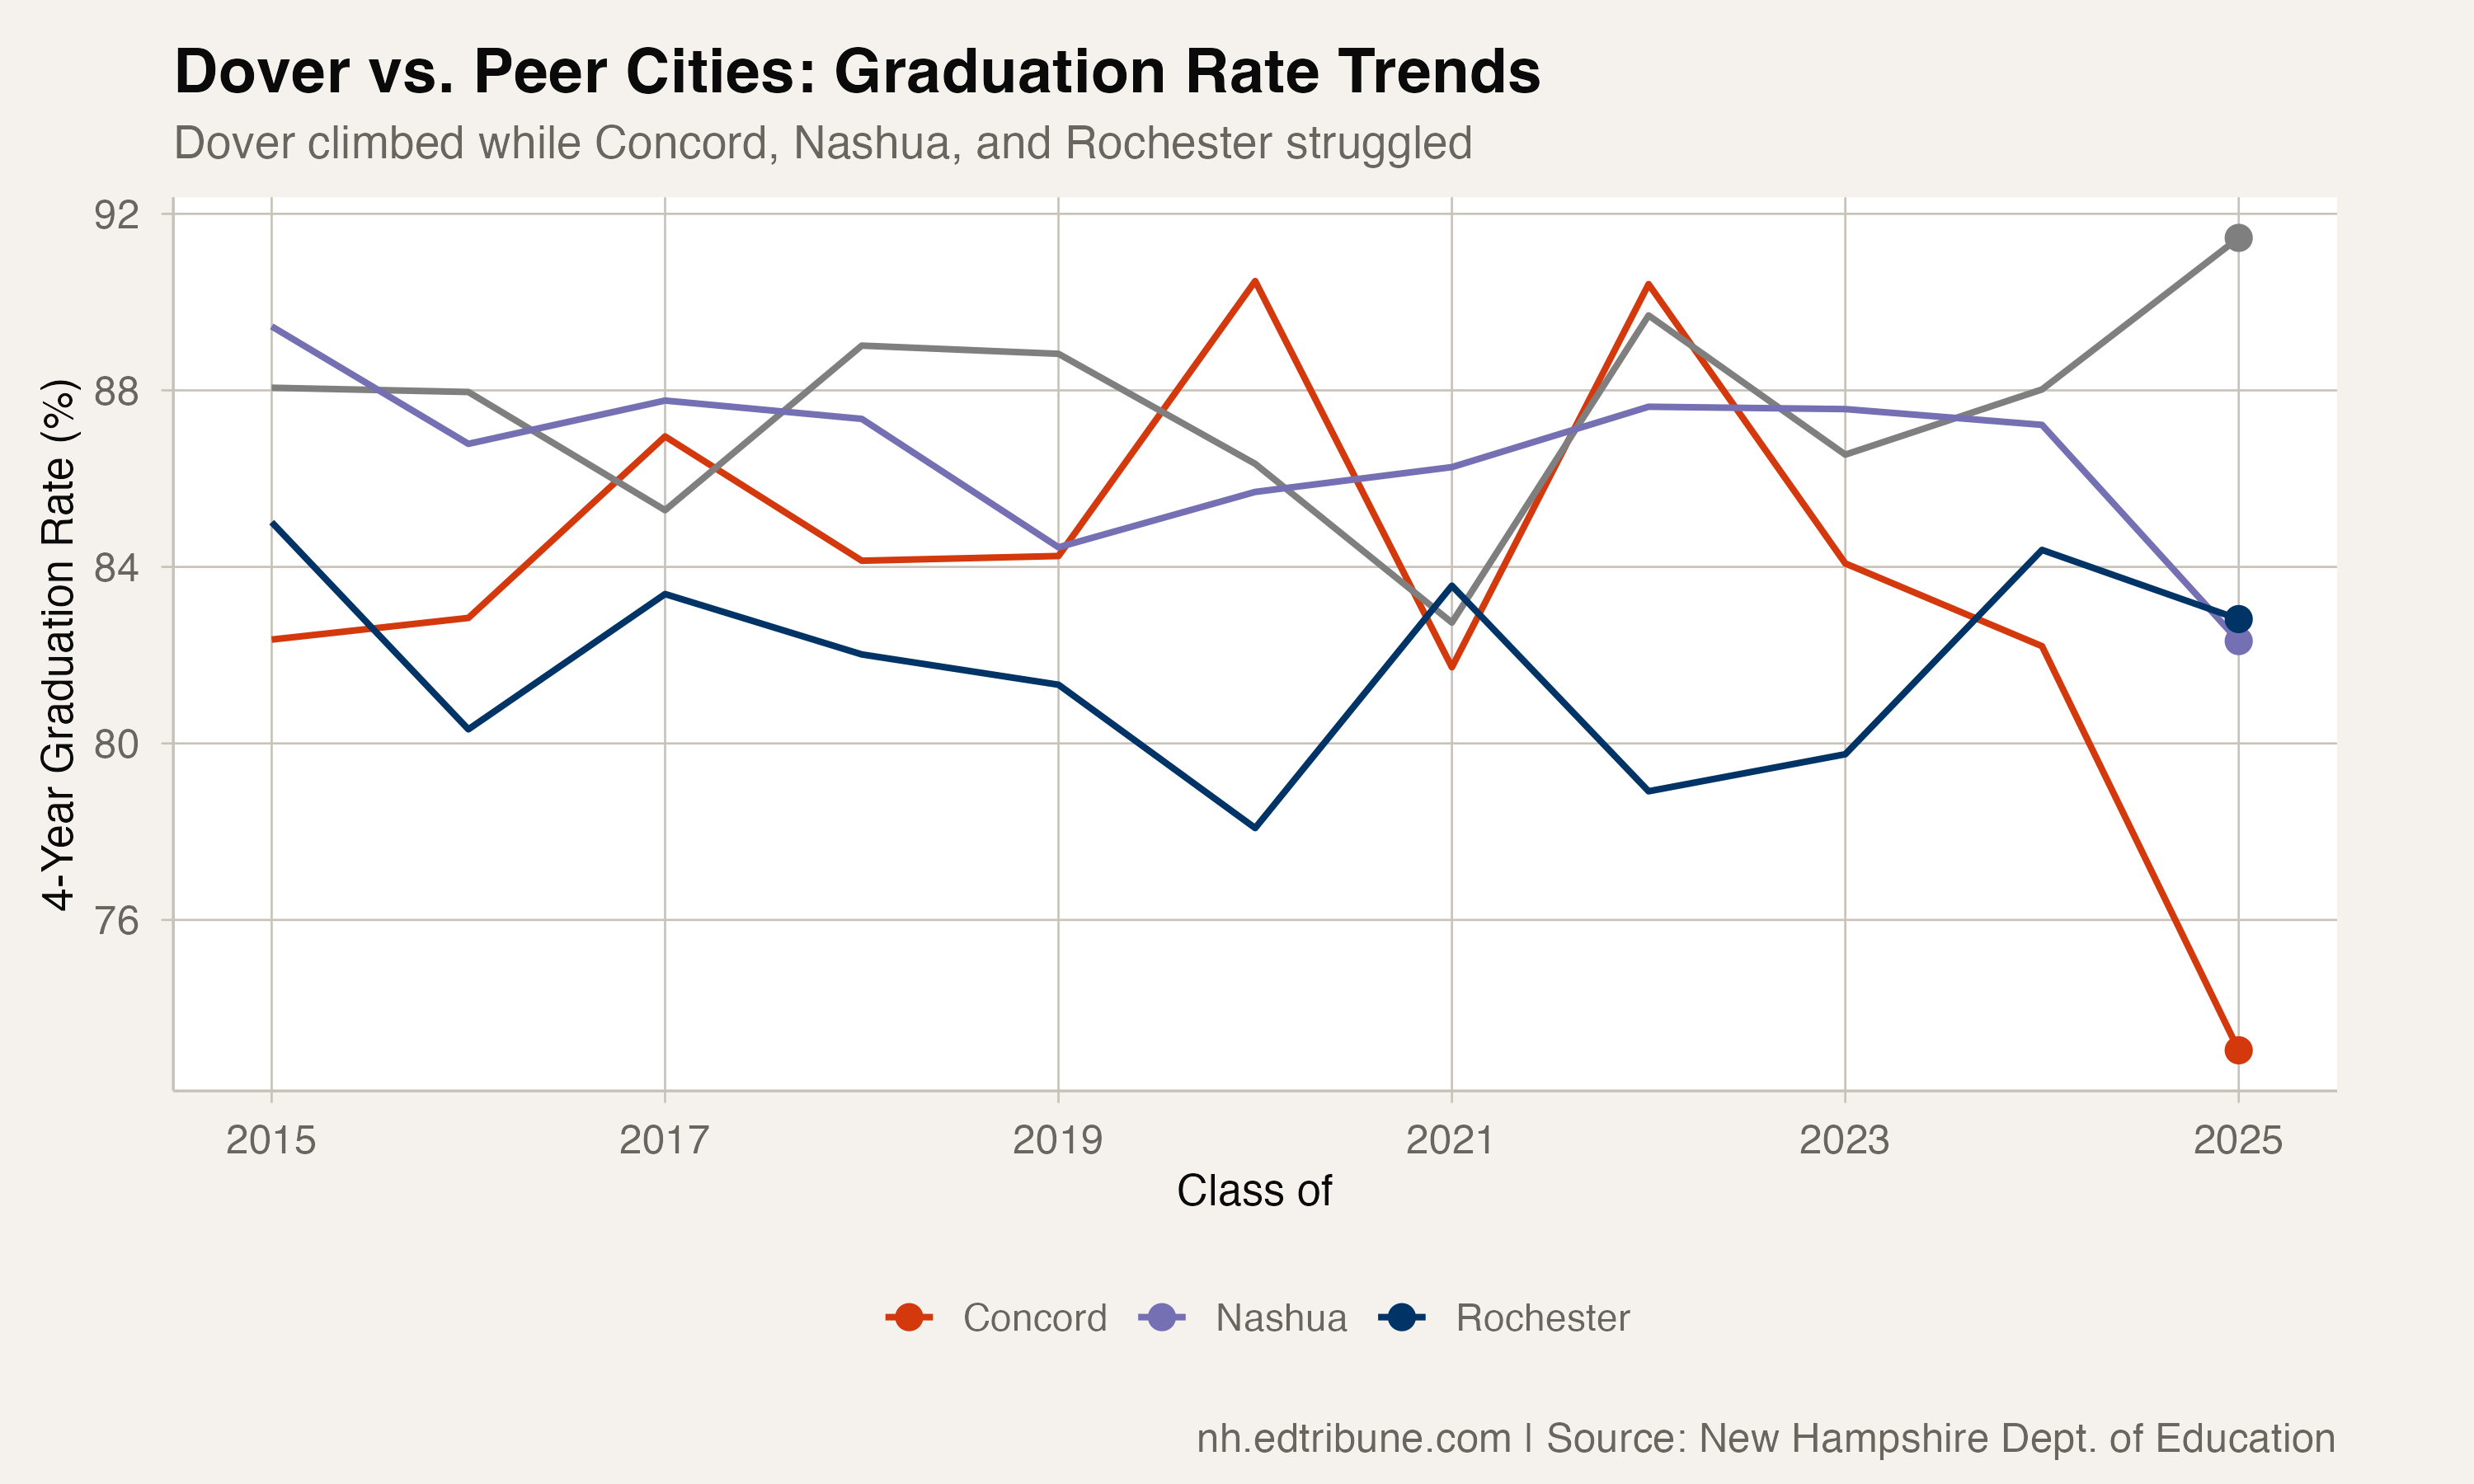
What makes Dover's performance stand out is the company it keeps — and the company it has left behind. Among New Hampshire's cities of comparable size:
- Rochester↗ET (355 cohort): 82.8 percent, down 2.2 points from 2015
- Concord↗ET (371 cohort): 73.0 percent, an all-time low
- Nashua↗ET (854 cohort): 82.3 percent, an all-time low
Dover now outperforms several suburban districts that have historically been among the state's strongest: Bedford↗ET at 87.8 percent, Londonderry↗ET at 87.8 percent, and Goffstown↗ET at 87.7 percent — all at their own all-time lows.
A Dropout Rate Near Zero
Dover's 2025 dropout rate was 0.3 percent — one student out of 316. The district has maintained a dropout rate below 2 percent in eight of 11 years on record, and below 1 percent in five of them. Combined with the 91.5 percent graduation rate, just 8.2 percent of Dover's cohort fell into the "unaccounted" category (still enrolled, transferred, or pursuing alternative credentials), well below the state's 10.3 percent.
The near-zero dropout rate suggests that Dover's high graduation rate is not achieved by pushing struggling students out the back door. Students who don't graduate on time are overwhelmingly still in the system, not leaving it.
What Dover Does Differently
The data alone cannot explain why Dover succeeds where similarly-sized cities struggle. Dover's 316-student cohort is large enough that small-N volatility does not account for the result. The city's economic profile — a mix of University of New Hampshire-adjacent professional employment and traditional New England working-class neighborhoods — is not dramatically different from Rochester or Concord.
What the data does show is consistency. Dover has exceeded the state average in 4 of 11 years — mostly in recent ones — and its worst year (82.7 percent in 2021) was still above the current rates of Concord, Manchester, and Nashua. The district does not produce dramatic swings — its standard deviation of 2.4 percentage points across 11 years is lower than Manchester, Bedford, Concord, and Hudson, though not the lowest among similarly-sized districts. Whatever Dover is doing, it appears to work across cohorts, not just for individual classes.
Data Source
This analysis uses four-year adjusted cohort graduation rate data from the New Hampshire Department of Education, covering the graduating classes of 2015 through 2025.
Detailed code that reproduces the analysis and figures in this article is available exclusively to EdTribune subscribers.
Discussion
Sign in to join the discussion.
Loading comments...