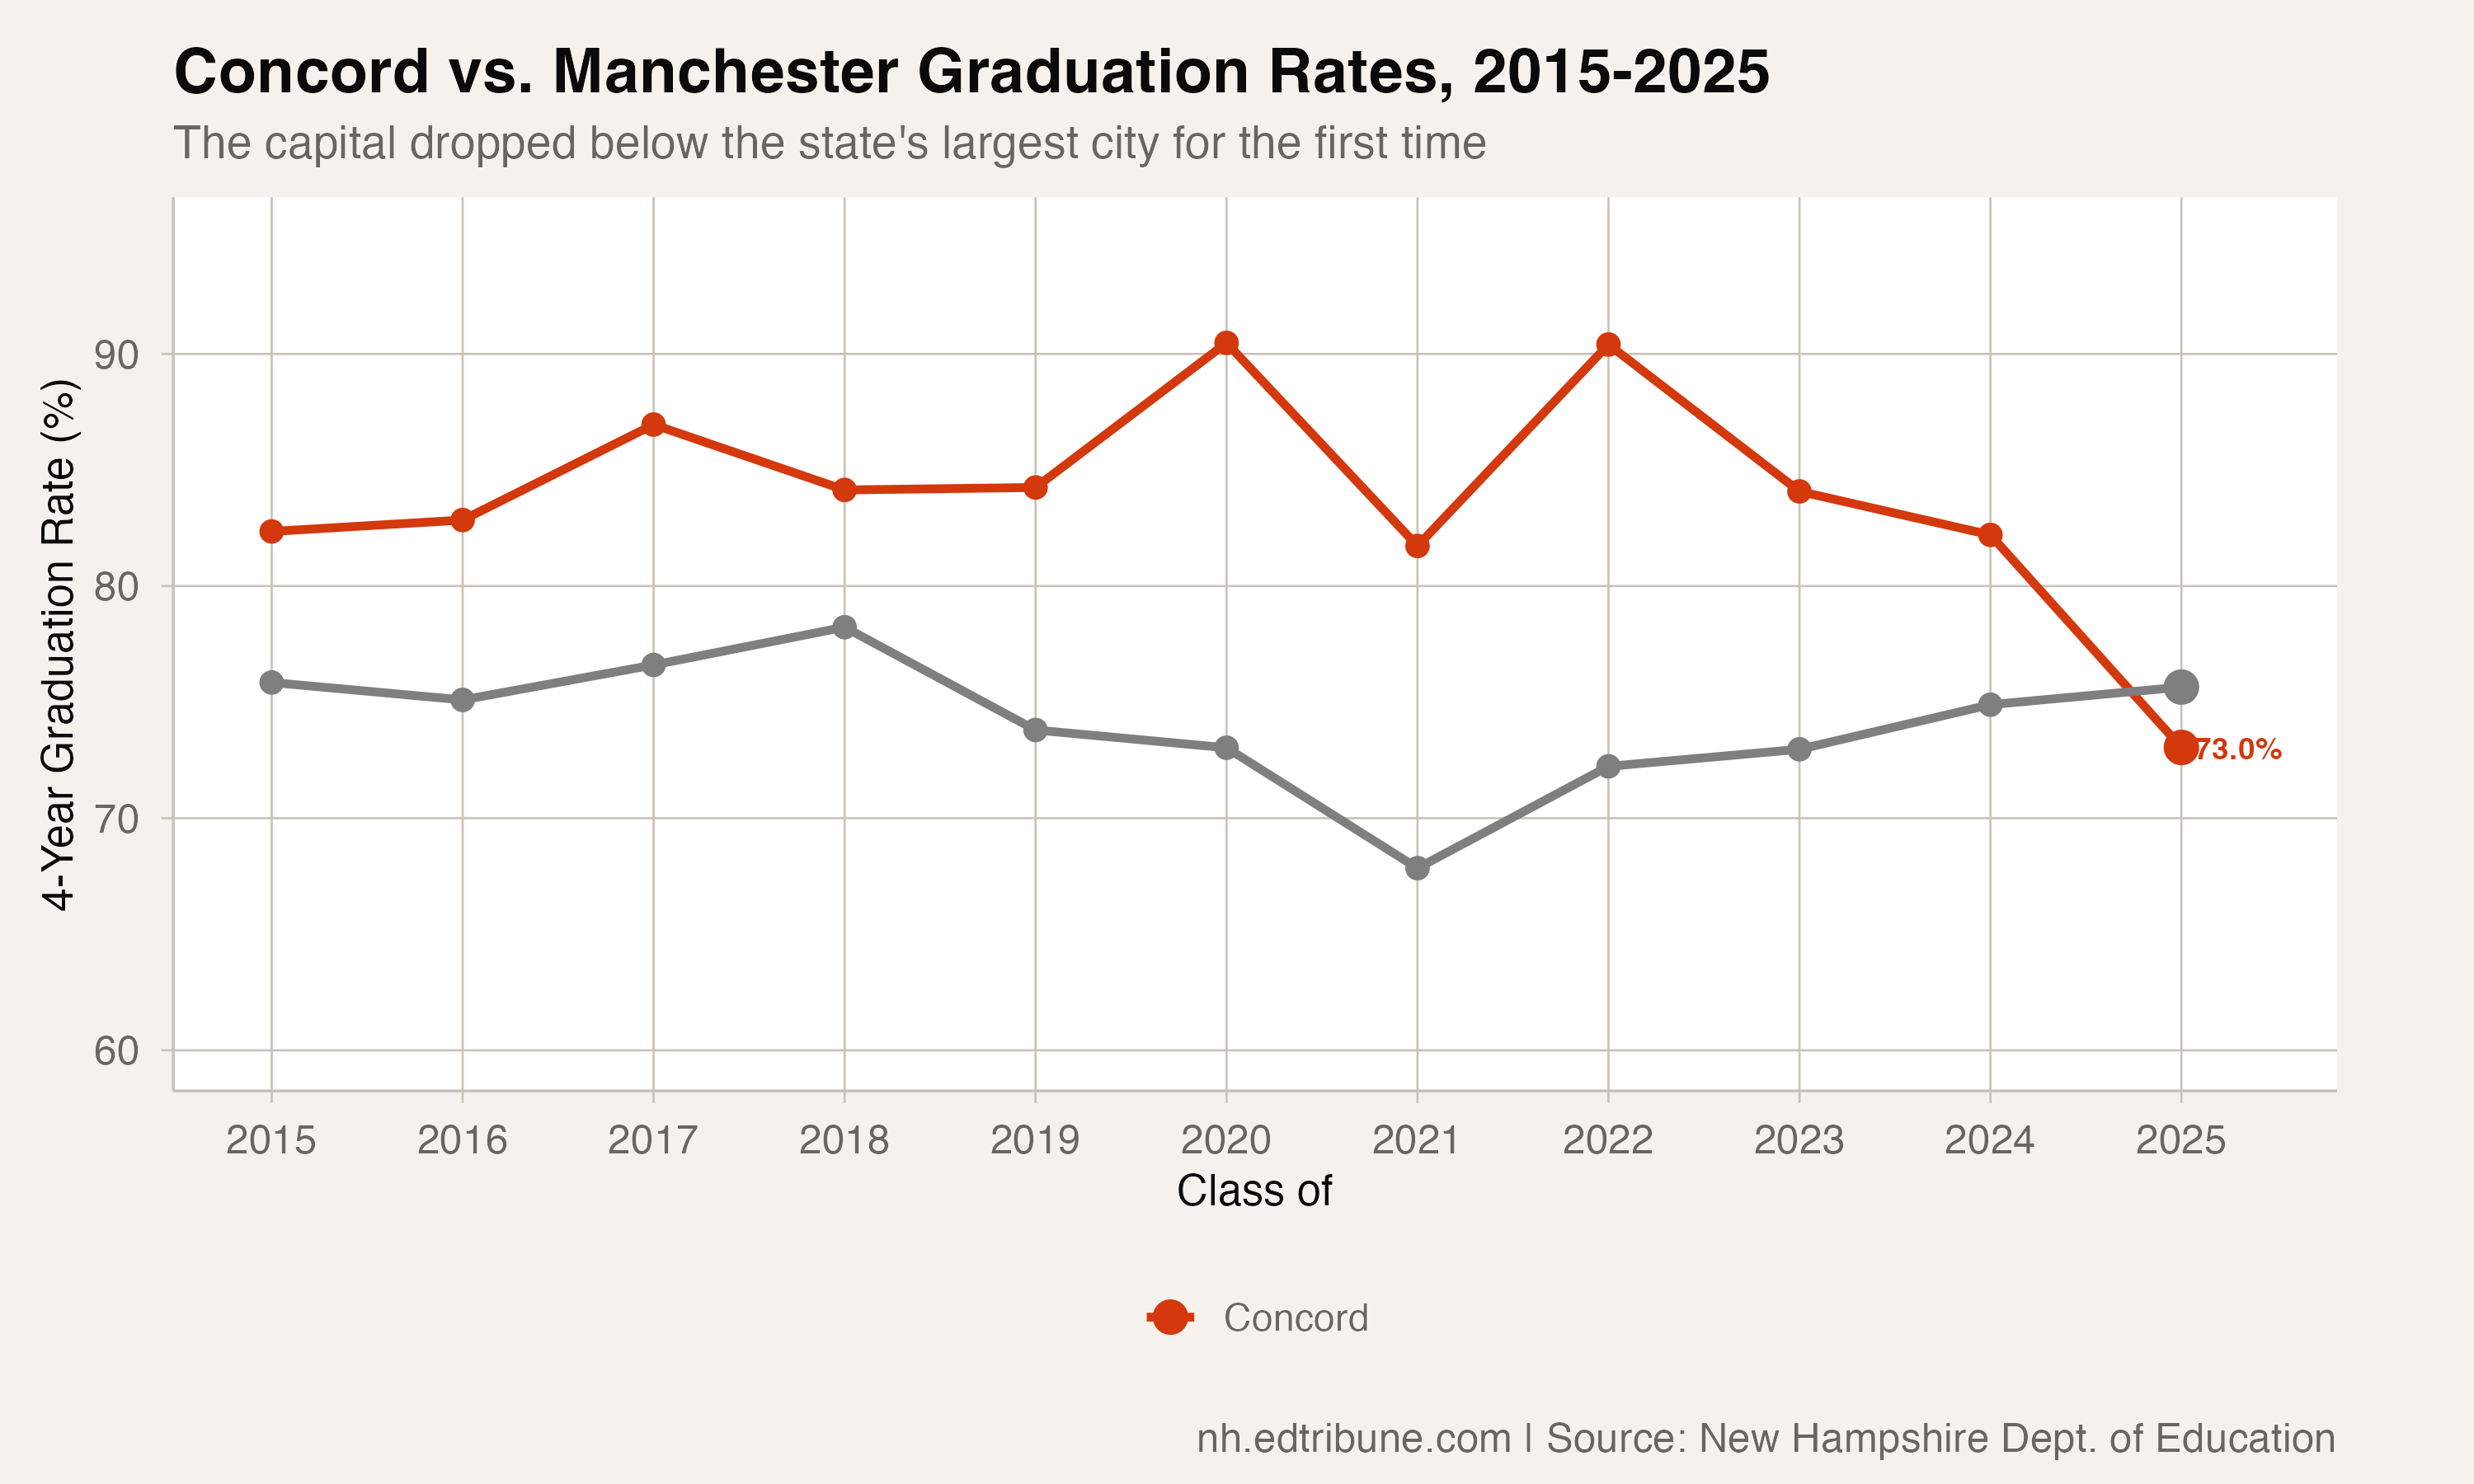
For as long as New Hampshire has published graduation data, one thing has been reliably true: Concord↗ET graduated a higher share of its students than Manchester↗ET. The capital city, home to the statehouse and a solidly middle-class population, outperformed the state's struggling industrial center by anywhere from 4 to 15 percentage points in any given year.
In 2025, that changed.
Concord's four-year graduation rate fell to 73.0 percent — an all-time low in at least 11 years of available data — while Manchester climbed to 75.6 percent. The capital now graduates a smaller share of its students than the city it has always looked down upon in the education rankings.
A 9-Point Freefall
The drop was sudden. In 2024, Concord posted an 82.2 percent graduation rate — not exceptional, but respectable and roughly in line with its decade-long average. One year later, the rate plunged 9.2 percentage points. In a district with a 371-student cohort, that translates to roughly 34 additional students who did not graduate on time compared to what the 2024 rate would have predicted.
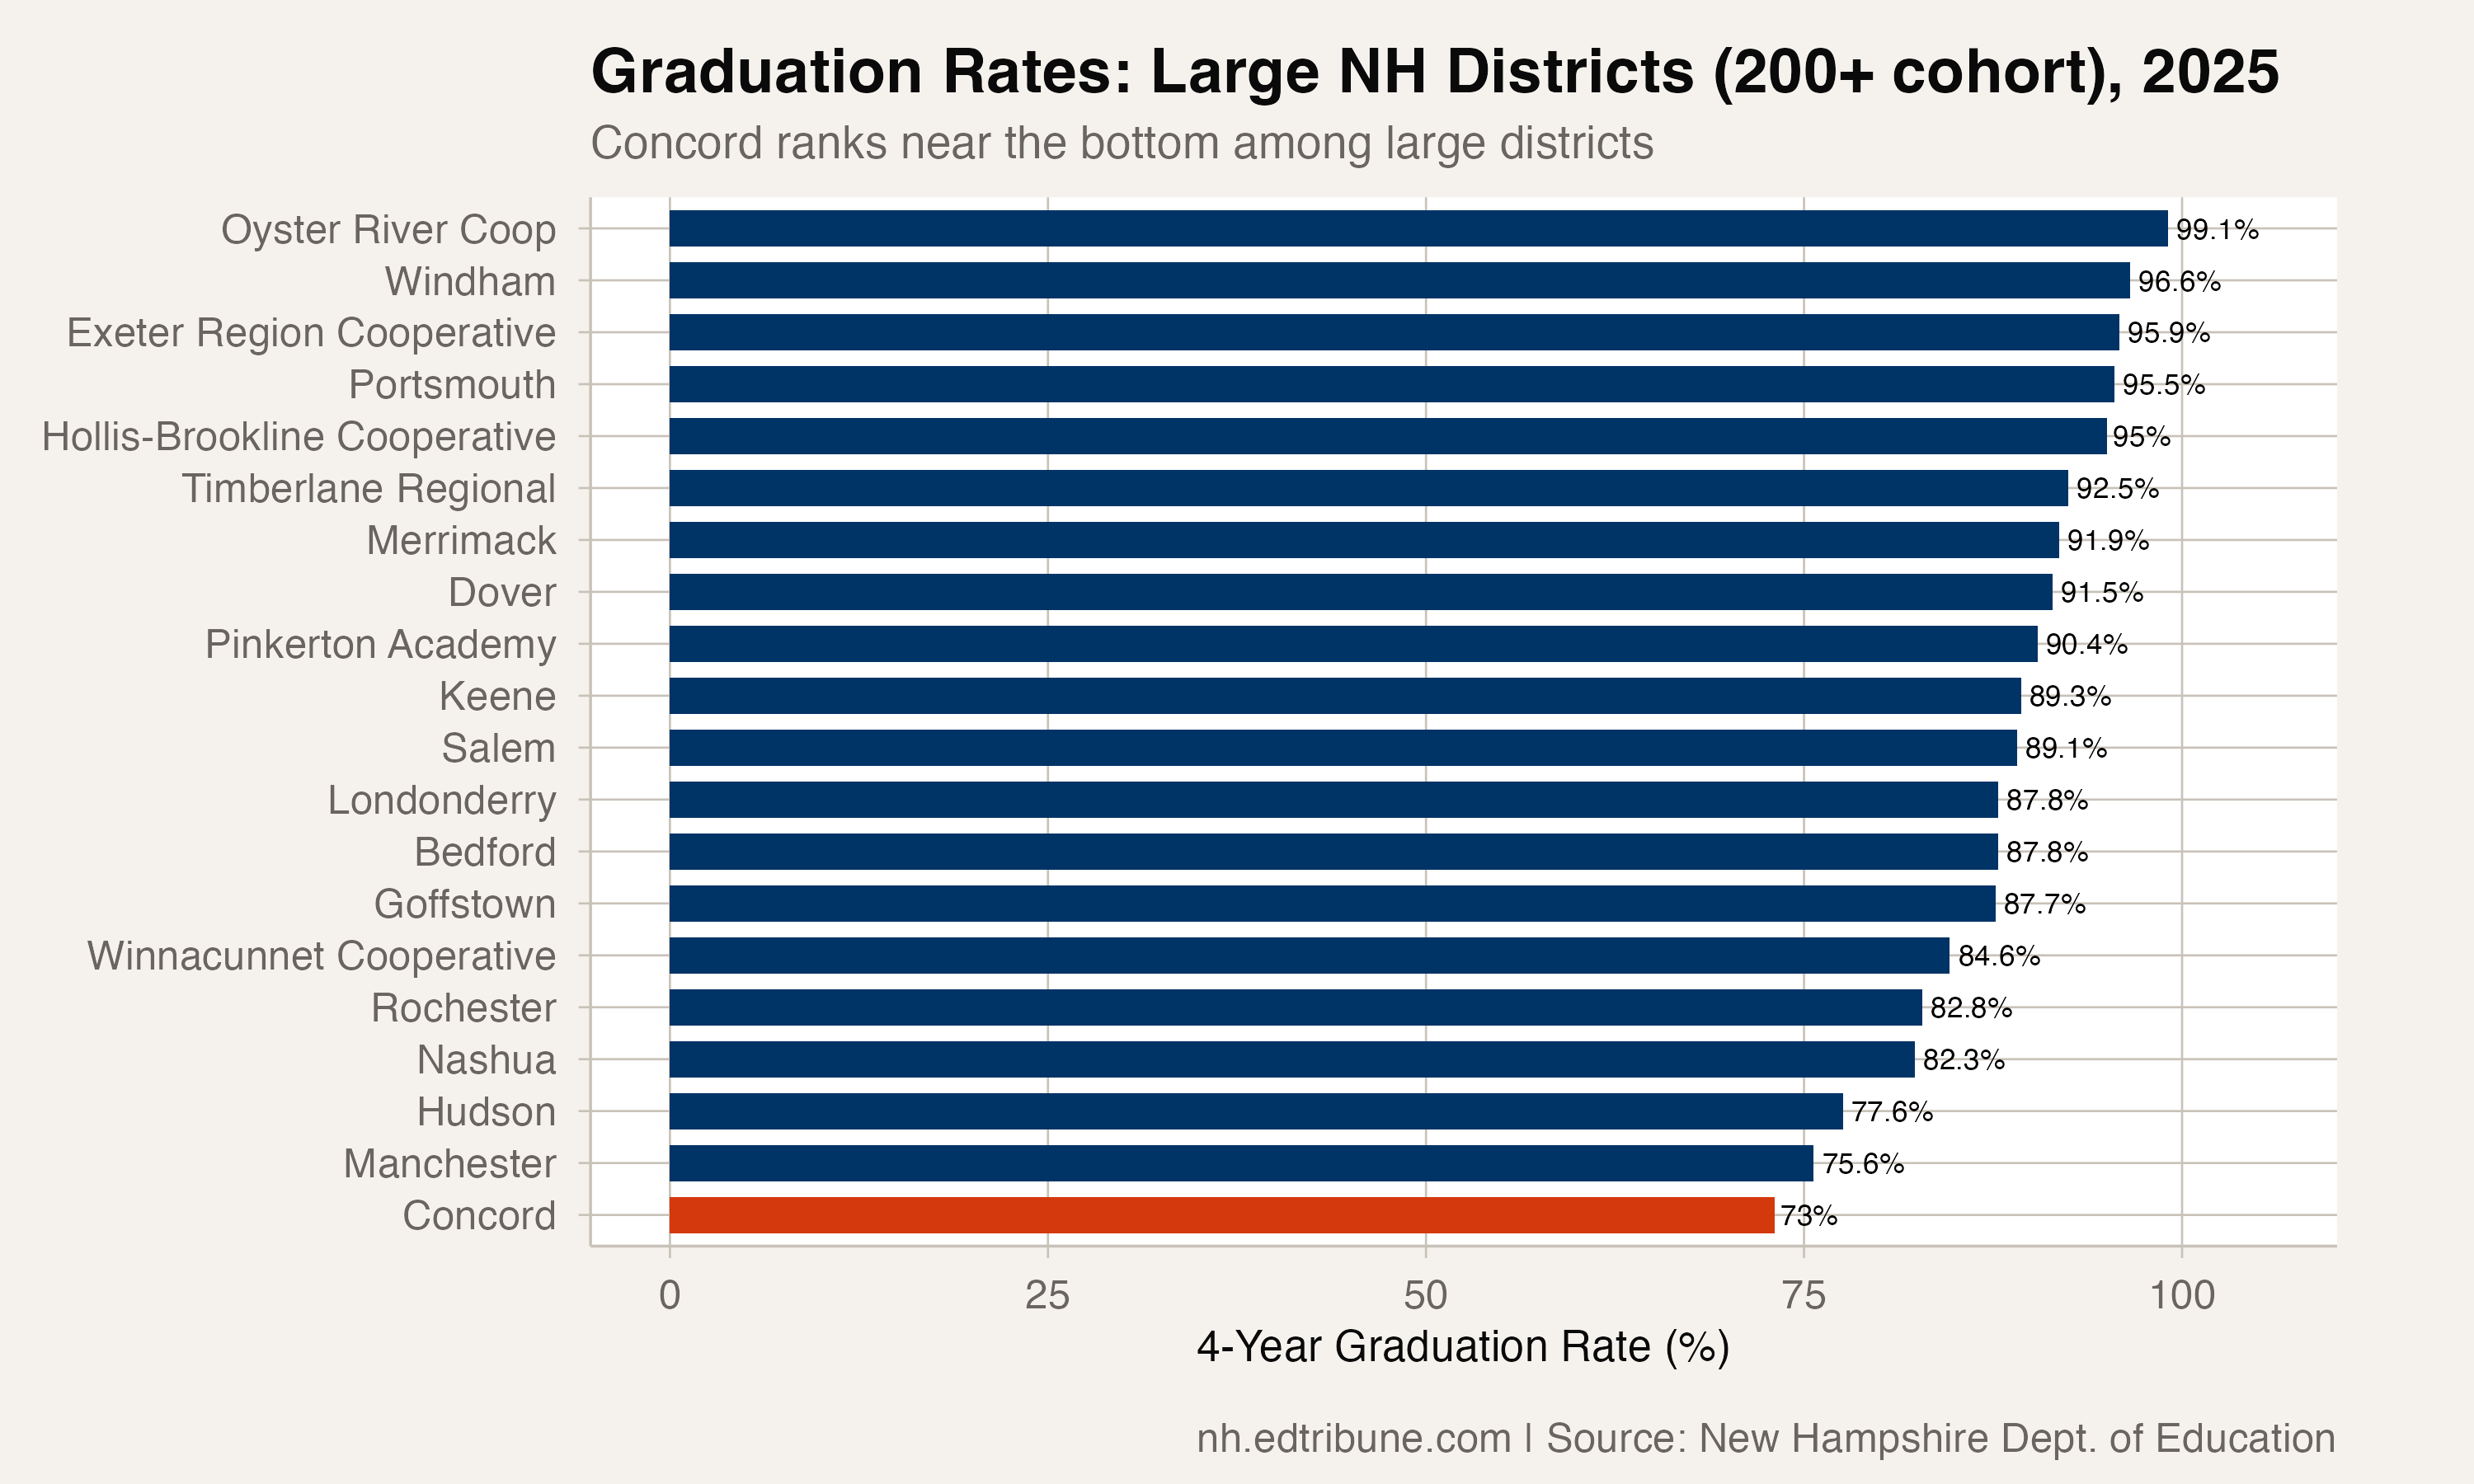
Concord's 2025 rate places it among the lowest traditional districts in the state. Only Manchester, at 75.6 percent, and Hudson↗ET, at 77.6 percent, post lower rates among districts with cohorts above 200 students.
The Volatility Problem
The 2025 crash, as dramatic as it is, fits a pattern. Concord's graduation rate has been the most volatile of any large district in New Hampshire, swinging across a 17.4-point range over 11 years — from a low of 73.0 percent to a high of 90.5 percent in 2020.
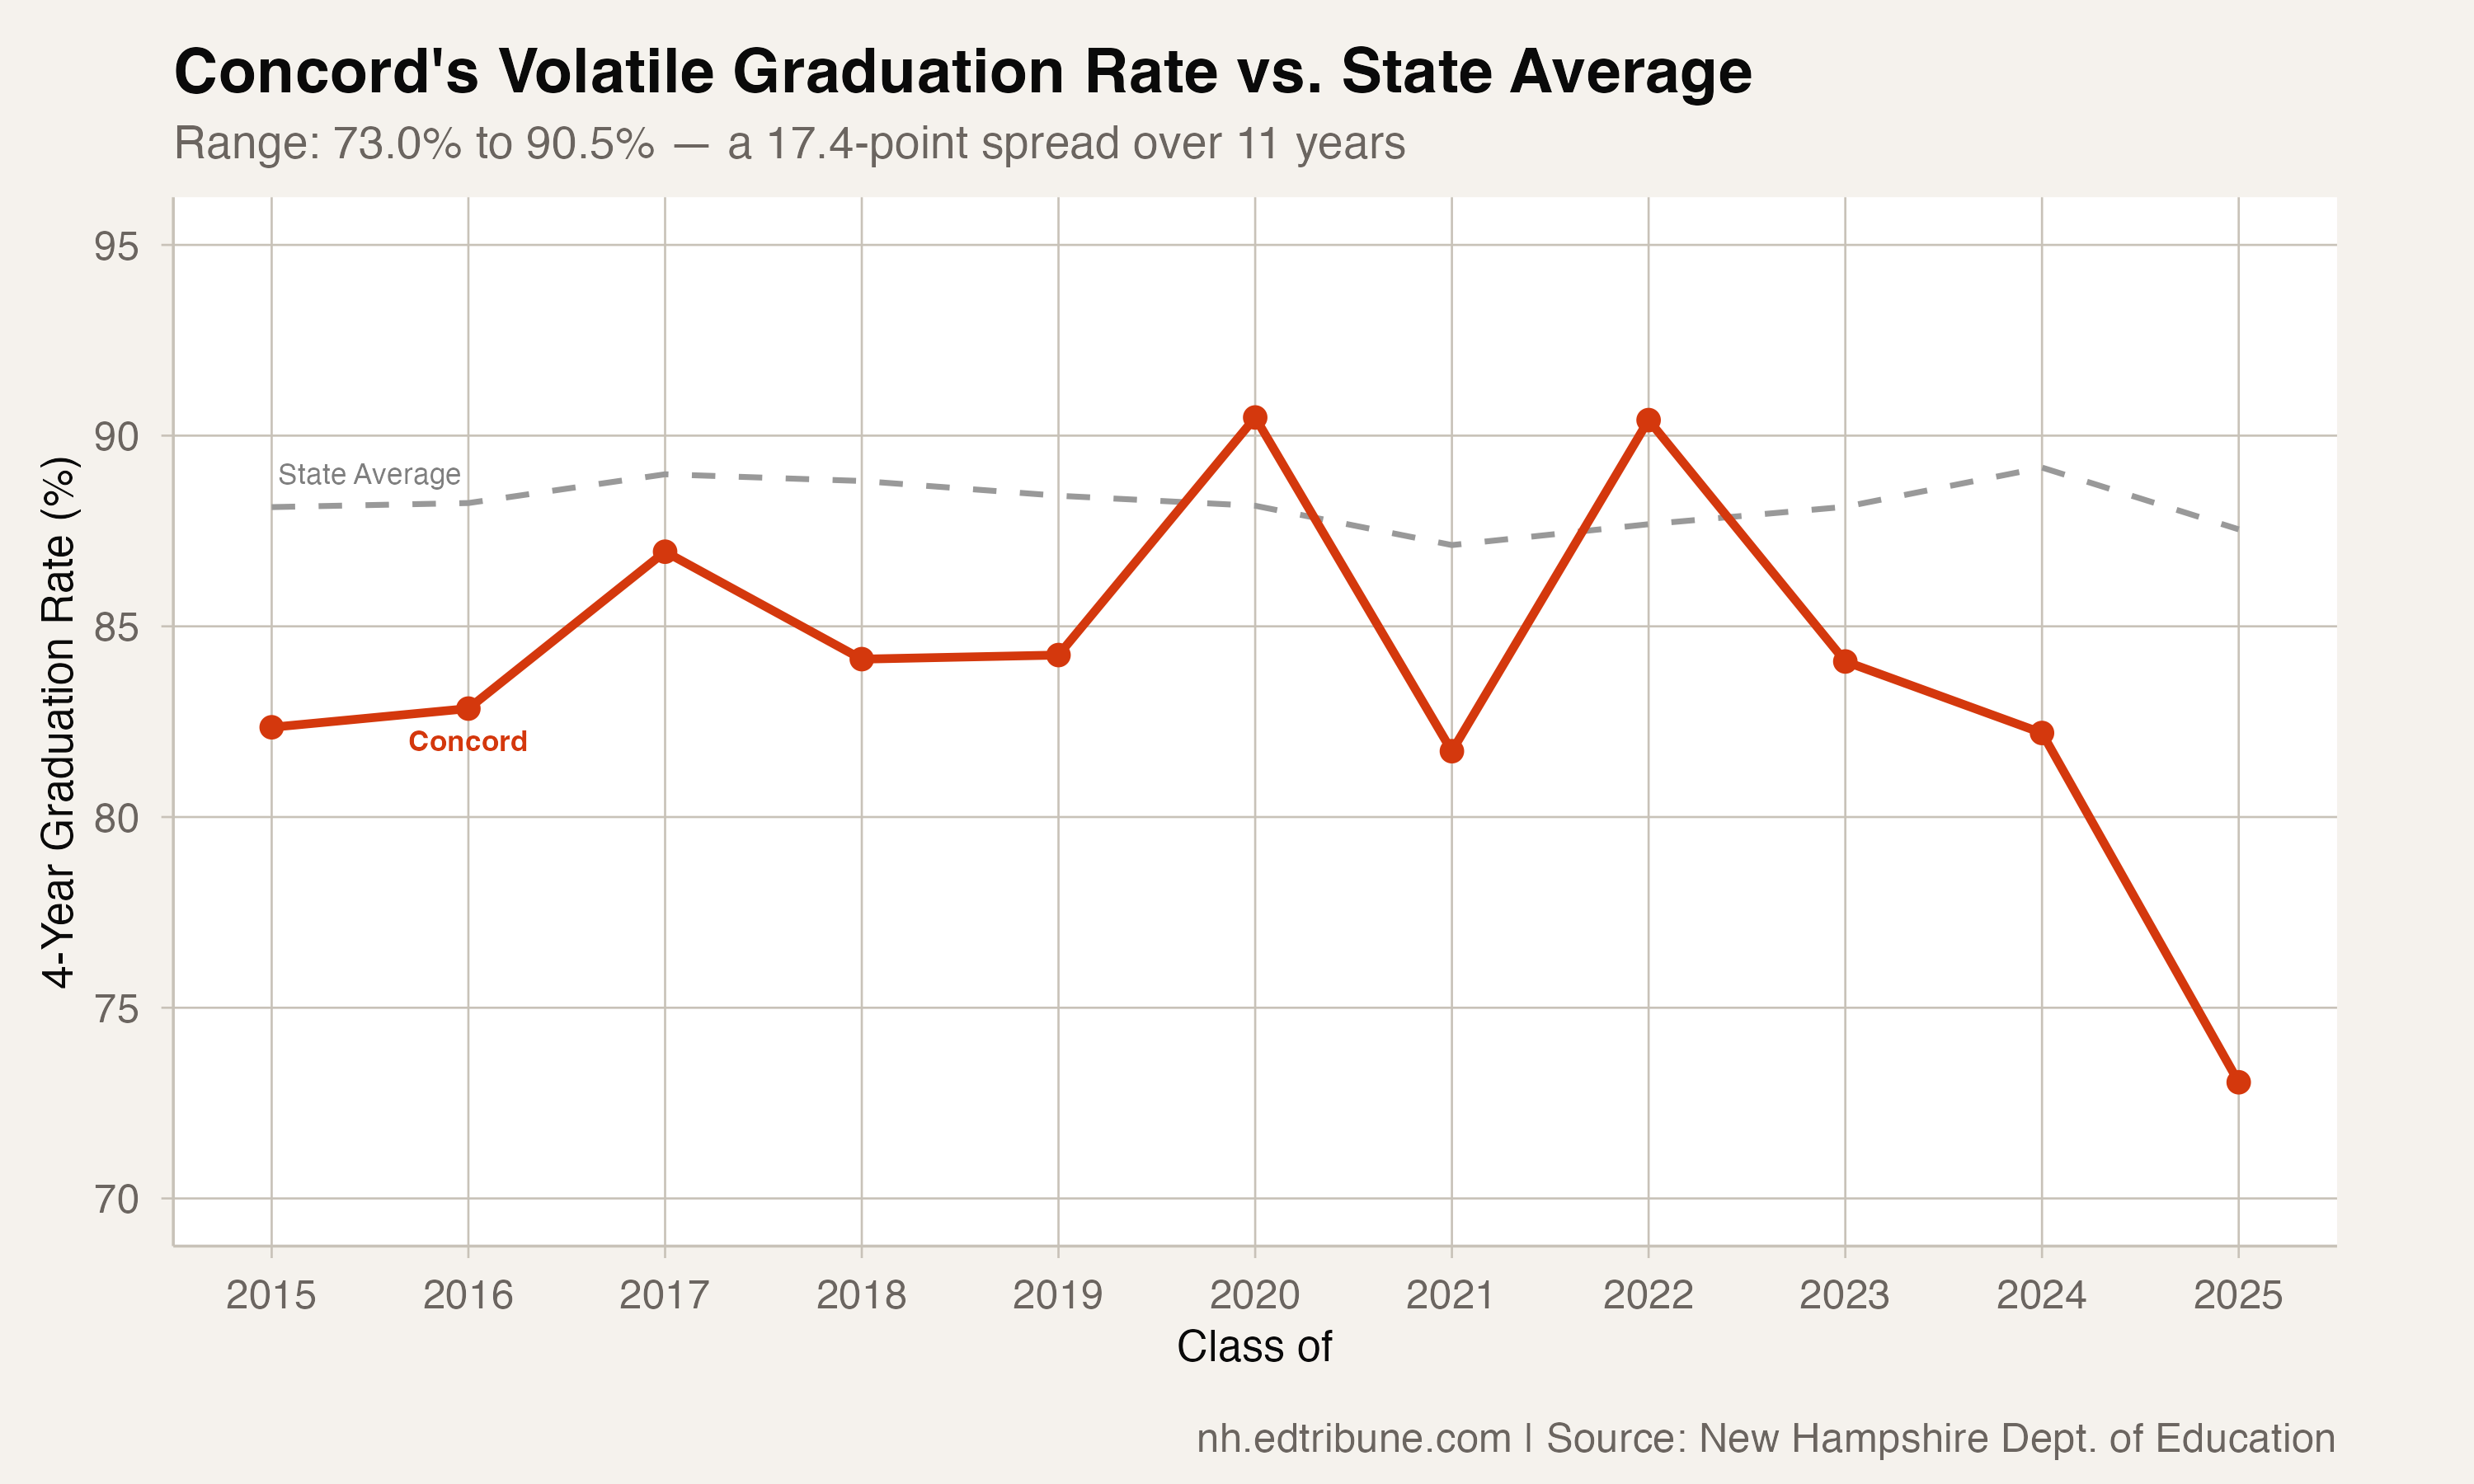
The trajectory reads like a sawtooth: 82.4, 82.8, 87.0, 84.1, 84.2, 90.5, 81.7, 90.4, 84.1, 82.2, 73.0. No other district with a cohort this size produces swings this extreme. With 371 students, small-cohort volatility does not explain the pattern — something structural is driving wild year-to-year variation.
Whether that structural factor is inconsistent support services, cohort composition that shifts dramatically from year to year, or some other cause is not visible in the data. What is visible is that Concord cannot sustain progress. Every gain is followed by a retreat, and the retreats have been getting deeper.
How the Cities Compare
Among New Hampshire's five largest cities, the 2025 results reshaped the hierarchy. Dover↗ET surged to 91.5 percent, an all-time high. Rochester↗ET held steady at 82.8 percent. Nashua↗ET slid to 82.3 percent, its own all-time low. Manchester continued a four-year improvement streak to reach 75.6 percent. And Concord crashed.
The gap between Concord and Manchester tells a decade-long story in miniature. In 2015, Concord (82.4 percent) was 6.6 points above Manchester (75.8 percent). In 2020, the gap peaked at 22.7 points, with Concord at 90.5 percent and Manchester at 67.8 percent. By 2025, the gap had not just closed — it had inverted. Manchester, for all its well-documented struggles, has now posted four consecutive years of improvement. Concord's trajectory runs in the opposite direction.
Not a Dropout Problem
Concord's dropout rate actually decreased slightly in 2025, from 1.4 percent to 1.1 percent. As with the statewide pattern, the decline was not caused by more students leaving school, but by more students failing to finish within four years.
New Hampshire does not report graduation rates by race, income, or disability status at the district level. Without that granularity, the 9.2-point decline raises more questions than it answers. Was this cohort different in composition? Did a support program end? Did chronic absenteeism spike?
Data Source
This analysis uses four-year adjusted cohort graduation rate data from the New Hampshire Department of Education, covering the graduating classes of 2015 through 2025.
Detailed code that reproduces the analysis and figures in this article is available exclusively to EdTribune subscribers.
Discussion
Sign in to join the discussion.
Loading comments...